
High TF Plotter
Gösterge
441 i̇ndirmeler
Sürüm 1.0, May 2025
Windows, Mac
4.6
Değerlendirmeler: 3
Açıklama
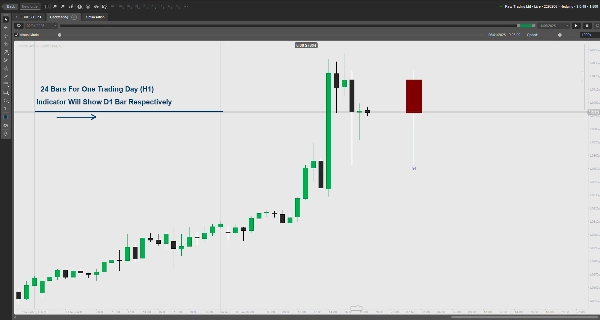
Daha düşük zaman dilimi grafiklerinde yüksek zaman dilimi fiyat hareketlerini gösterir. Açılış/kapanış, fitiller ve boğa/ayı renkleriyle ana bölgeleri gösterir. Özelleştirilebilir.
Ana Özellikler:
- Yüksek zaman dilimi (örneğin, Günlük) fiyat hareketlerini daha düşük zaman dilimi grafiklerinin üzerine bindirir.
- Özelleştirilebilir boğa/ayı renkleriyle açılış/kapanış fiyat dikdörtgenlerini gösterir.
- Ana fiyat seviyeleri için fitil prim/indirim bölgelerini vurgular.
- Grafik aralığı için yapılandırılabilir boşluk.
- Geçersiz zaman dilimi ayarları için hata yönetimi.
Yardımcı olup olmadığını bize bildirmek için lütfen bir inceleme bırakın.
Özet
YZ özeti
High TF Plotter is a trading indicator that overlays high timeframe price action onto lower timeframe charts. It visually represents open and close prices using customizable bull and bear colored rectangles. The tool highlights wick premium and discount zones to mark key price levels, aiding in the identification of significant market areas. Users can adjust chart spacing through a configurable margin setting. The indicator includes error handling for invalid timeframe inputs, ensuring reliable operation. This functionality supports analysis by combining broader timeframe context with detailed lower timeframe data.
Gösterge profili
Müşteri değerlendirmeleri
4.6
Değerlendirmeler: 3
5 | 67 % | |
4 | 33 % | |
3 | 0 % | |
2 | 0 % | |
1 | 0 % |
Müşteri değerlendirmeleri
January 27, 2026
It would have been very helpful if it were possible to configure the time for NY EST
August 18, 2025
Clear higher timeframe level plotting, customizable, lightweight. Cons: No auto-labels, no multi-timeframe overlays, no alerts.
May 29, 2025
Muito bom, mas se tivesse a linha de abertura, máxima e mínima seria perfeito. Obrigada.
Tartışma
SSS
cTrader Store üzerinden erişilebilen işlem botları, göstergeler ve eklentiler gibi ürünler, üçüncü taraf sağlayıcılar tarafından sağlanır ve yalnızca bilgilendirme ve teknik erişim amaçlarıyla sunulur. cTrader Store bir broker değildir ve yatırım tavsiyesi, kişisel öneriler vermez veya gelecekteki performansı garanti etmez.
Bu oluşturanın diğer ürünleri


Fiyat
86.67M
İşlem hacmi
1.99M
Kazanılan pip
3.66K
Ücretsiz yüklemeler