
Compare Symbol
Gösterge
192 i̇ndirmeler
Sürüm 1.0, May 2025
Windows, Mac
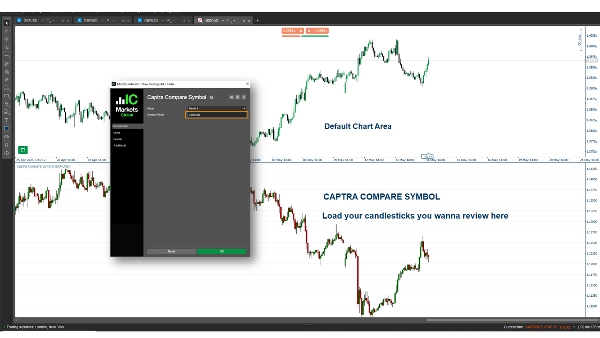
Captra Compare Symbol, seçilen bir sembolün, örneğin EURUSD'nin, kapanış fiyatını gösteren ve grafik üzerinde mum çubukları (fitil, gövde) çizen bir cTrader göstergesidir. Doğru temsil için açılış/kapanış/yüksek/düşük fiyatları kullanarak, özelleştirilebilir görsellerle çeşitli zaman dilimlerini (örneğin, 5D, 15D, 1S, Günlük) destekler.
Gösterge profili
0.0
Değerlendirmeler: 0
Müşteri değerlendirmeleri
Bu ürün için henüz bir değerlendirme yok. Ürünü denediniz mi? O zaman ona dair görüşlerini paylaşan ilk kişi olun!
EURUSD
cTrader Store üzerinden erişilebilen işlem botları, göstergeler ve eklentiler gibi ürünler, üçüncü taraf sağlayıcılar tarafından sağlanır ve yalnızca bilgilendirme ve teknik erişim amaçlarıyla sunulur. cTrader Store bir broker değildir ve yatırım tavsiyesi, kişisel öneriler vermez veya gelecekteki performansı garanti etmez.
Bu oluşturanın diğer ürünleri


86.17M
İşlem hacmi
1.91M
Kazanılan pip
3.57K
Ücretsiz yüklemeler