
说明
https://chartshots.spotware.com/c/695bff3f3bc21
https://chartshots.spotware.com/c/695bffac03fb1
https://chartshots.spotware.com/c/695c0002aabb7
📊 自动斐波回撤
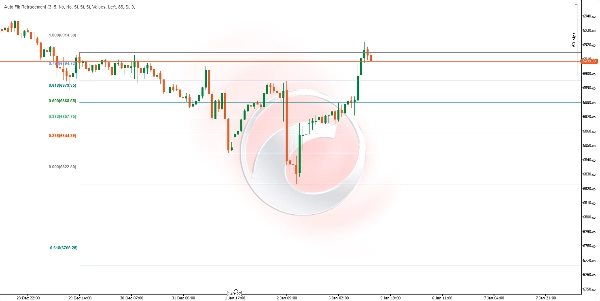
自动斐波回撤 是一种技术分析指标,能够 自动绘制基于最近重要价格变动的斐波那契回撤和扩展水平。与手动斐波工具不同,该指标自动检测市场枢轴点并实时更新水平。
⚙️ 它是如何工作的?
自动枢轴点检测
该指标使用动态ZigZag算法识别重要的价格高点和低点:
- 回溯深度(Lookback): 定义向后分析多少根K线以确认枢轴点。数值越高检测较大波动;数值越低对较小波动更敏感。
- 敏感度(偏差): 控制价格变动必须达到多大程度才能形成新的枢轴点。通过将 10周期ATR(平均真实波幅) 乘以此因子计算。数值越高过滤噪音,仅检测重要波动。
斐波那契水平计算
一旦识别出最近的两个枢轴点(一个高点和一个低点),指标使用经典斐波那契公式计算每个水平:
水平 = 锚定价格 + (波动范围 × 斐波那契比率)
其中:
- 锚定价格: 最近的枢轴点价格(如果方向反转,则为前一个枢轴点)
- 波动范围: 两个枢轴点之间的差值
- 可用比率: 0, 0.236, 0.382, 0.5, 0.618, 0.65, 0.786, 1, 1.272, 1.414, 1.618, 1.65, 2.618, 2.65, 3.618, 3.65, 4.236, 4.618, 和负数水平 (-0.236, -0.382, -0.618, -0.65)
📈 它的用途是什么?
UseDescription
识别支撑与阻力
水平 0.382, 0.5, 和 0.618 是价格倾向反应的经典区域 🔵
确定价格目标
扩展水平(1.618, 2.618, 3.618, 4.236) 帮助预测价格可能达到的距离 🎯
规划入场点
寻找回调至关键水平以顺势入场 ⬆️⬇️
设置止损
将止损设置在相关斐波那契水平之外 🛑
确认反转区域
当价格达到极端扩展水平时,可能表示行情疲软 🔄
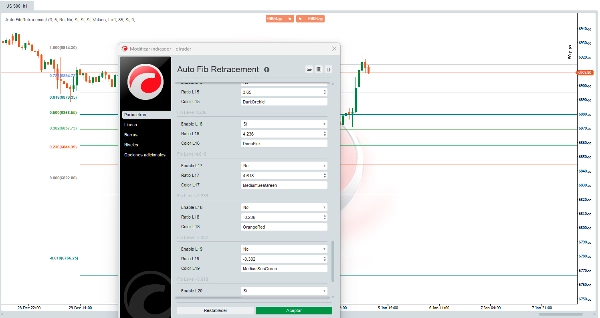
🛠️ 如何使用
主要参数
参数说明建议值
敏感度
偏差乘数,用于过滤次要波动
3(默认)
回溯深度
计算枢轴点的最小K线数量
10(默认)
反转方向
反转水平计算的参考点
禁用
显示选项
选项功能
向左/右延伸
将水平线延伸到图表的左侧或右侧
显示价格
显示每个水平的精确价格
显示比率
显示斐波那契比率(数值或百分比)
标签位置
将标签定位在左侧或右侧
区域透明度
控制水平之间彩色区域的透明度
可配置的斐波那契水平
22个水平中的每一个都可以:
- 单独启用或禁用
- 修改其数值
- 更改其颜色
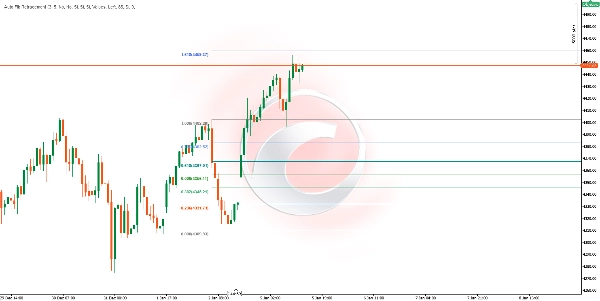
💡 区域解读
连续水平之间的彩色区域便于视觉识别:
- 绿/蓝区域 (0.382 - 0.786): 趋势中的健康回调区域。常见的入场区域。✅
- 1.0水平区域: 代表前一波动的100%。作为关键支撑/阻力。⚖️
- 红/粉区域 (1.618+): 波动的扩展。价格达到这些区域可能表示过度延伸。⚠️
⚠️注意事项
- 当检测到新的重要枢轴点时,指标会 自动 更新
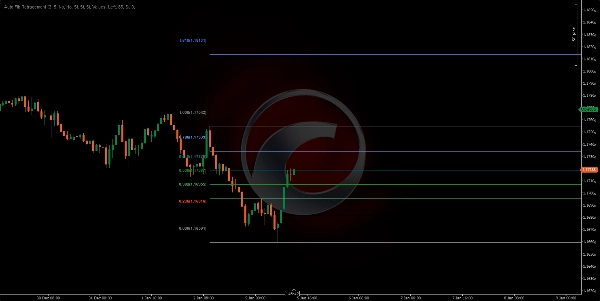
- 适用于 任何时间框架和金融资产
- 斐波那契水平是 概率区域,而非保证
- 建议与其他指标或价格行为分析 结合使用
- 在盘整或震荡市场中,枢轴点可能频繁变化
📝 技术说明
- 内部使用 10周期ATR 计算枢轴检测的动态阈值
- 指标需要 至少相当于回溯参数两倍的历史数据 才能正常工作
- 线条和区域仅在最后一根K线上 重绘 以优化性能 🚀
摘要
The indicator helps traders identify potential support and resistance zones, define price targets, plan entries on pullbacks, set stop-losses beyond key levels, and confirm reversal zones when price reaches extreme extensions. It works on any timeframe and financial asset, including Forex, stocks, commodities, indices, and cryptocurrencies such as BTCUSD, EURUSD, GBPUSD, XAUUSD, NAS100, and others.
Users can customize parameters like sensitivity, lookback period, direction inversion, and display options (line extension, price and ratio labels, zone opacity, and colors). Colored zones visually highlight key Fibonacci areas for easier interpretation. The indicator updates automatically with new pivots and redraws levels on the latest bar to optimize performance.


!["High-Low Divergence [Iridio Capital]" 标识](https://cdn.ctrader.com/image/webp/443c4661-7abb-40f1-842f-4b6ec560649b_40914)

