
说明
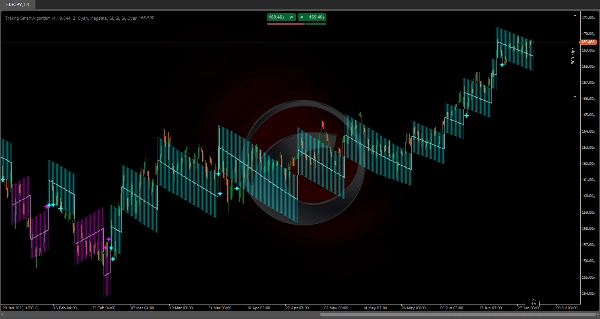
跟踪智能算法
https://chartshots.spotware.com/c/69f0f1d89000b
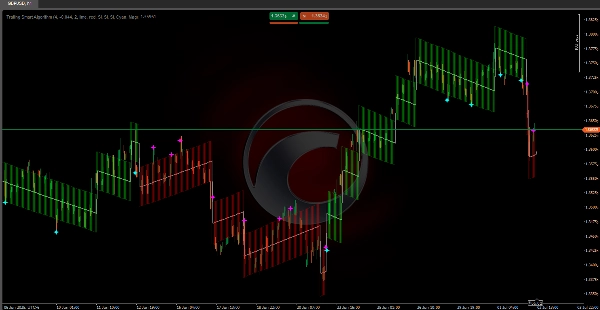
结合了 数学算法 🧠 专门设计用于持续跟踪 任何市场状况 🌐 的价格。
其计算结构确保 趋势线始终与价格走势同步,避免了传统指标的典型滞后 ⏳。
与传统算法不同,该系统使用 精确的波动性测量 📊 并应用 自动调整 ⚙️,保证最佳跟踪。其内部计算旨在提供 市场方向的准确表现,在快速变动 ⚡ 和渐进趋势发展 🕊️ 期间保持精确。
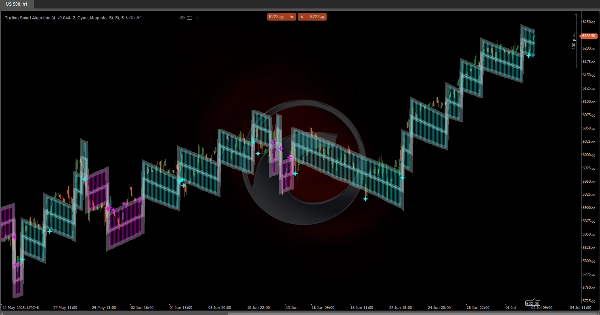
https://chartshots.spotware.com/c/69f0f218591b0
💡 它是如何工作的?
该指标使用一个 自适应步进系统,沿主导趋势方向移动。
它基于 三个主要组成部分:
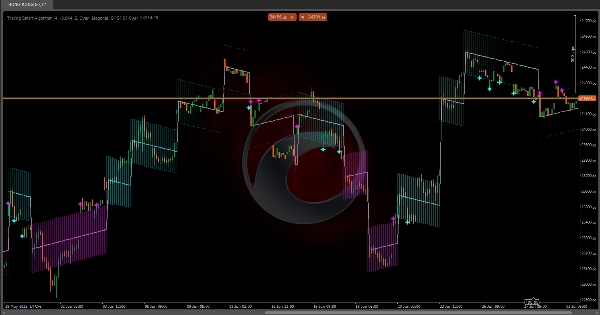
https://chartshots.spotware.com/c/69f0f2b19e4d3
1️⃣ 趋势变化检测
系统持续监控价格,以检测超过特定阈值的显著变动(冲击触发器 🎯)。
当价格远离当前趋势线足够远时,指标识别出 潜在的方向变化并重新定位其主线。
2️⃣ 动态跟踪
一旦方向确定,趋势线将 逐步 🪜 沿市场相同方向移动。
每一步均基于当前波动率计算(ATR 📈):
• 在 更波动的市场,步长更大 🌊
• 在 较平静的市场,步长更小 🌿
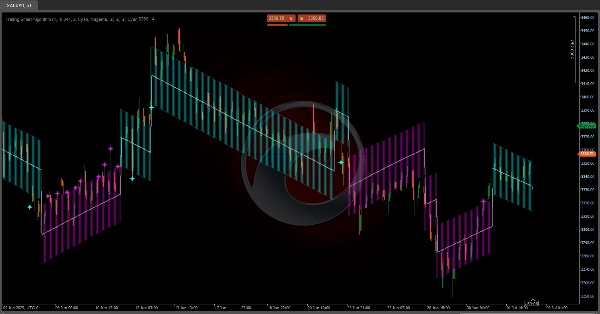
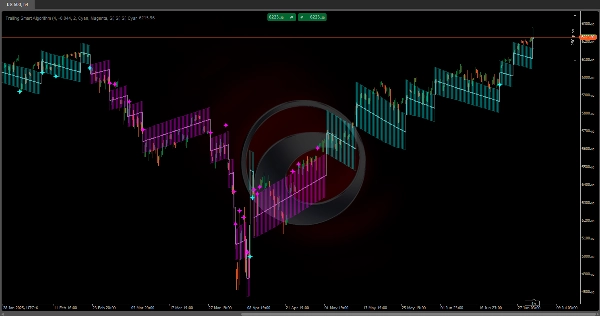
3️⃣ 波动率通道
在主线周围形成一个通道(上轨和下轨),代表 正常波动区间 📉📈。
该通道有助于识别价格是在正常范围内波动还是出现 极端变动 🚨。
📏 波动率通道
• 上轨: 波动率通道的上限
• 下轨: 波动率通道的下限
✨ 重测信号
• 青色星星 🌟: 价格在 上升趋势 中触及或穿越下轨
• 品红色星星 ⭐: 价格在 下降趋势 中触及或穿越上轨
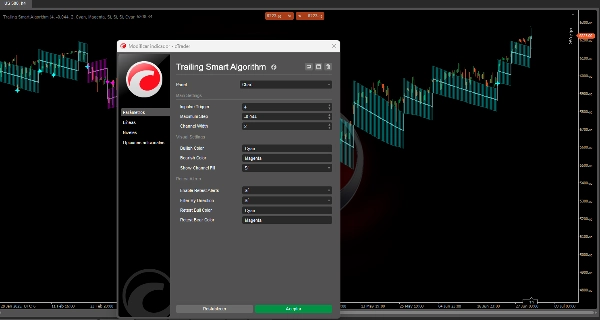
⚙️ 参数设置
🔹 主要参数
冲击触发器 (默认值:4)
作用是什么?
决定 检测趋势变化的灵敏度。它是ATR的乘数,定义价格必须移动多少才能触发方向变化。
修改时的影响:
• 较高值(5–8):
- 对趋势变化更具抵抗力 🛡️
- 减少错误信号
- 对真实变化反应较慢
• 较低值(2–3):
- 更高灵敏度 🎯
- 反应更快
- 更可能在横盘市场产生 错误信号
最大步长 (默认值: -0.044)
作用是什么?
限制趋势线每一步的 最大步长。这是一个负值,作为上限。
修改时的影响:
• 较少负值(-0.020 到 -0.030):
- 步长更大 🚀
- 趋势跟踪更激进
• 更负值(-0.050 到 -0.080):
- 步长更小,更 渐进 🌱
- 跟踪更保守
通道宽度 (默认值:2)
作用是什么?
定义主线周围 波动率通道的宽度。
修改时的影响:
• 较高值(3–4):
- 通道更宽 🟢
- 重测信号更少
- 对波动性的容忍度更高
• 较低值(1–1.5):
- 通道更窄 🔴
- 重测信号更多
- 对噪音更敏感
🎨 视觉参数
多头颜色 / 空头颜色
分别定义 上升趋势和下降趋势 的颜色。
显示通道填充
启用或禁用 波动率通道的视觉填充 🌈。
🔔 重测设置
启用重测提醒
当价格触及通道边界时切换重测信号。
按方向过滤
启用时,仅显示 与当前趋势匹配的重测信号:
• 在 上升趋势 中:仅显示 下轨
• 在 下降趋势 中:仅显示 上轨
🌟 重测信号回顾
• 下轨上的青色星星: 来自动态支撑的潜在 多头反弹 ✅
• 上轨上的品红色星星: 来自动态阻力的潜在 空头反弹 ❌
摘要
客户评价
5 | 100 % | |
4 | 0 % | |
3 | 0 % | |
2 | 0 % | |
1 | 0 % |


