说明
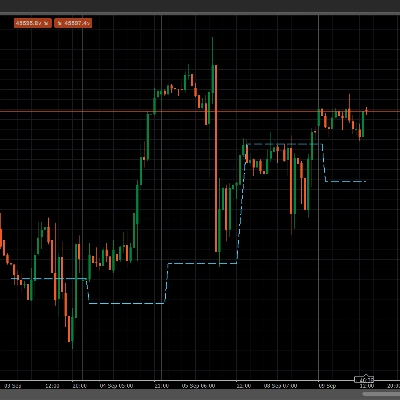
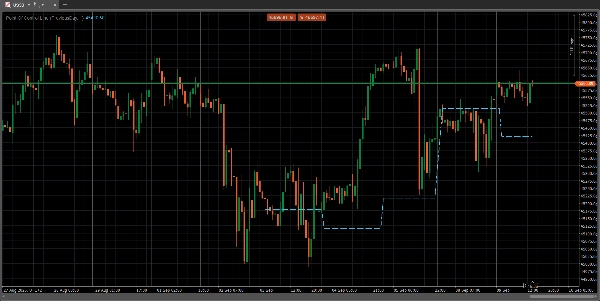
控制点是成交量分布图上的一个价格水平,在指定期间内该价格水平的交易量最大。这个水平作为一个重要的支撑或阻力区域,因为它代表了大型交易机构最活跃的价格,也是市场价格达成共识的地方。交易者使用这条线来识别关键价格区间,评估市场情绪,并预测潜在的价格走势和反转。
摘要
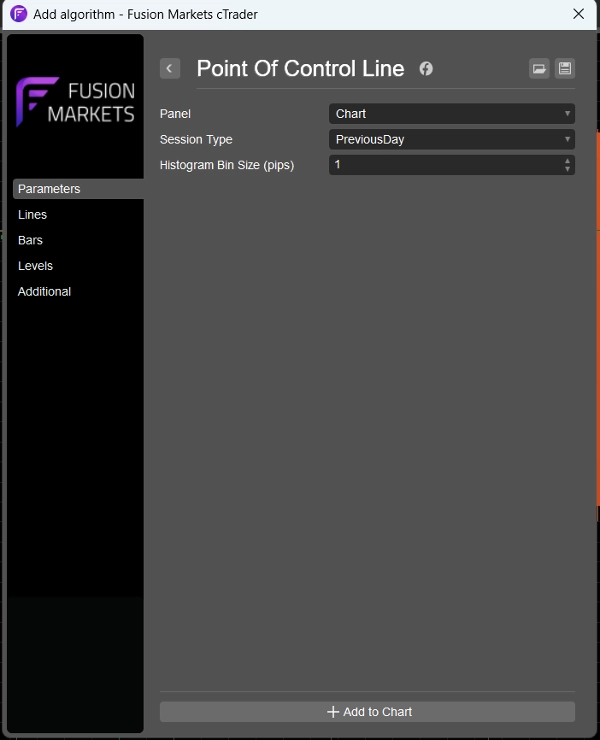
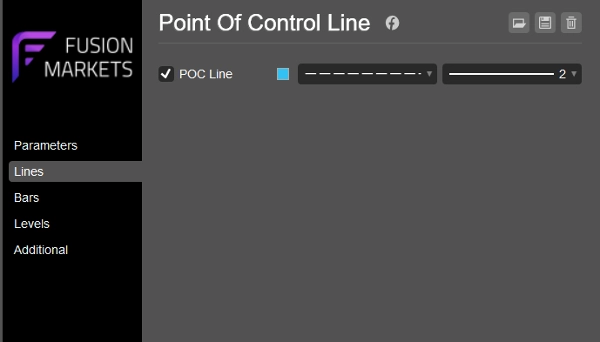
指标配置
客户评价
0.0
评价:0
客户评价
该产品尚无评价。已经试过了?抢先告诉其他人!
讨论
常见问答
Forex
Indices
cTrader Store 提供的所有产品,包括交易机器人、指标和插件,均由第三方开发者提供,仅供信息参考和技术访问之用。cTrader Store 并非经纪商,不提供投资建议、个人推荐或任何未来业绩保证。
该作者的其他作品

猜您喜欢


价格
注册日期 21/04/2025