
NewsGuard High-Impact News Risk Overlay
Indikator
2 käufe
Version 1.0, Jan 2026
Windows, Mac
5.0
Bewertungen: 1
Beschreibung
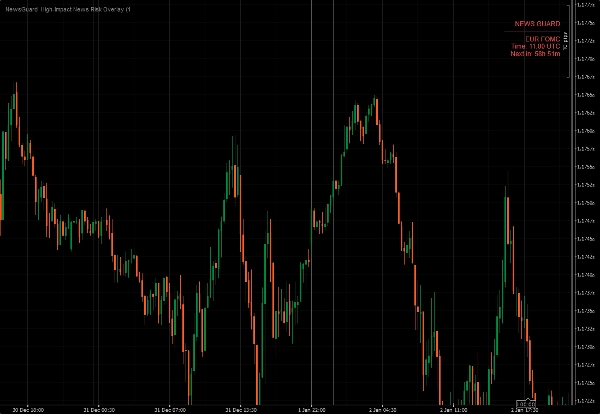
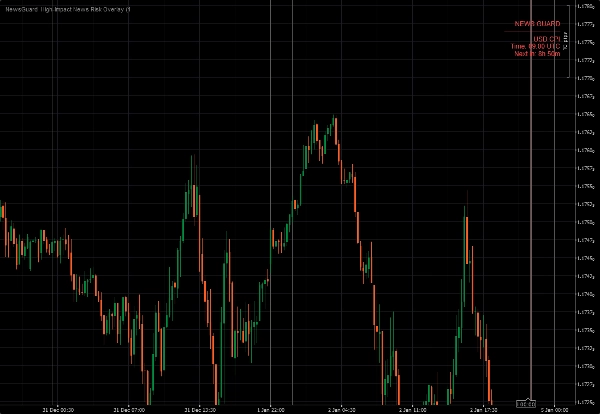
NewsGuard – High-Impact News Risk Overlay ist ein professionelles Risiko-Bewusstseins-Tool für cTrader.
Es hebt visuell Zeitfenster rund um wichtige wirtschaftliche Ereignisse hervor, die bekanntermaßen extreme Volatilität, Spread-Ausweitungen und Slippage verursachen.
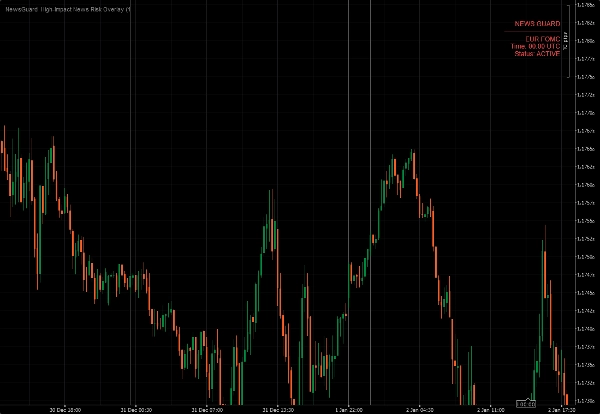
Anstatt nach der Bewegung zu reagieren, warnt NewsGuard Sie bevor das Risiko steigt.
Was NewsGuard zeigt
- Risiko-Zonen für Nachrichten mit hoher Auswirkung direkt im Chart
- Anpassbares Zeitfenster vor und nach jedem Ereignis
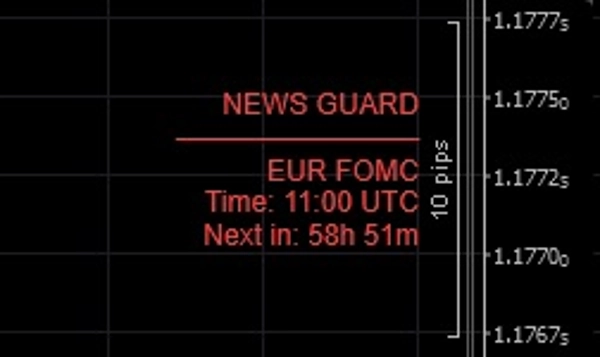
- Saubere Überlagerung mit bevorstehenden oder aktiven Nachrichteninformationen
- Automatische Relevanzfilterung basierend auf dem gehandelten Symbol
NewsGuard verwendet einen manuellen High-Impact-Zeitplan, wodurch es:
- zuverlässig
- speichersicher
- unabhängig von externen Feeds oder APIs
Was NewsGuard NICHT ist
- Kein Nachrichten-Feed
- Keine Prognosen
- Keine Handelssignale
Es existiert nur zu einem Zweck:
um Sie auf zeitbasierte Risiken aufmerksam zu machen.
Perfekt für Scalper, Daytrader und alle, die vermeiden möchten, blind in wichtige Nachrichtenereignisse zu handeln.
Zusammenfassung
KI-Zusammenfassung
NewsGuard High-Impact News Risk Overlay is a risk-awareness indicator designed for the cTrader platform. It visually marks time windows around major economic events known to cause significant market volatility, spread widening, and slippage. The overlay displays high-impact news risk zones directly on trading charts, allowing traders to anticipate periods of increased risk before volatility occurs. Users can adjust the time windows before and after each event to suit their trading preferences. The tool automatically filters news relevance based on the traded symbol, providing a clean and focused overlay with upcoming or active news information. NewsGuard relies on a manually maintained high-impact news schedule, ensuring reliability and independence from external data feeds or APIs. It does not provide news feeds, forecasts, or trade signals; its sole purpose is to enhance trader awareness of time-based risk. This indicator is suitable for scalpers, day traders, and others who want to avoid entering trades blindly during major news events. Supported markets include Forex, indices, and popular symbols such as GBPUSD, XAUUSD (gold), and NAS100.
Indikatorprofil
Kundenbewertungen
5.0
Bewertungen: 1
5 | 100 % | |
4 | 0 % | |
3 | 0 % | |
2 | 0 % | |
1 | 0 % |
Kundenbewertungen
January 16, 2026
Poor entries are easier to skip, but the tool is just one part of the process.
Diskussion
Häufig gestellte Fragen (FAQ)
Forex
Breakout
Scalping
Indices
GBPUSD
XAUUSD
NAS100
Über den cTrader Store verfügbare Produkte, einschließlich Handelsbots, Indikatoren und Plugins, werden von externen Entwicklern bereitgestellt und nur zu Informations- und technischen Zugriffszwecken verfügbar gemacht. cTrader Store ist kein Broker und erbringt keine Anlageberatung, persönlichen Empfehlungen oder eine Garantie für zukünftige Performance.
Mehr von diesem Autor


![„[CB] Pivot Points Pro“-Logo](https://cdn.ctrader.com/image/webp/43463c82-67b0-4f10-a4ba-901bba091d81_32594)

Preis
Seit 02/01/2026
2
Verkäufe