说明
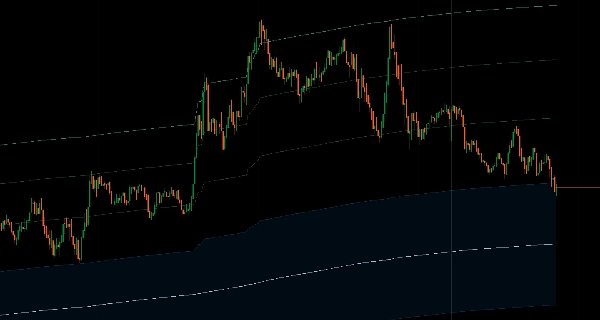
将移动平均计算锁定在任何市场时刻,并随着其向前延伸跟踪价格行为。
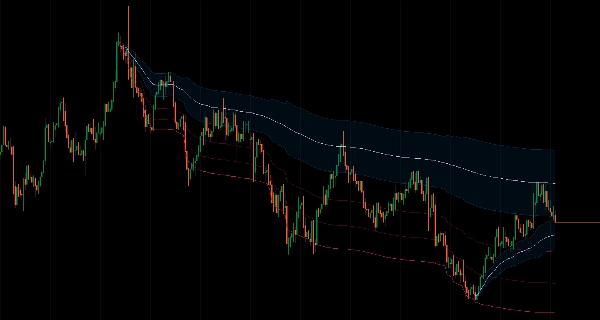
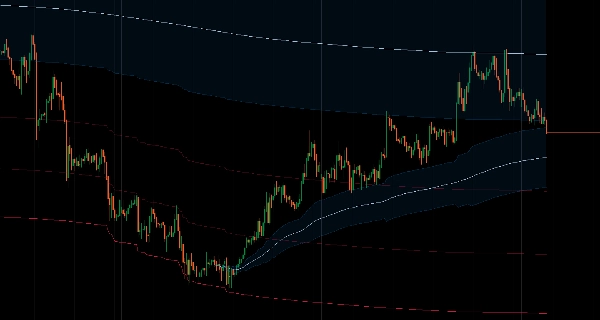
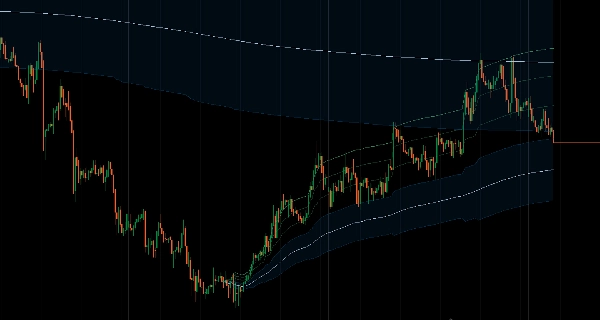
将计算固定在您选择的起点(手动日期时间或从1小时到10年的回溯期),然后根据实际价格范围自然增长,采用自适应斐波那契带。
八个斐波那契水平(11.4%至100%)适应真实价格变动,内置38.2%-62.8%均值回归区,双重MA类型(SMA/EMA),多种显示模式(完整带、仅极限边界、仅回归区),以及长时间框架的最大周期限制,为交易者提供基于事件的动量跟踪,针对重要波动点的回撤和事件后价格行为分析。
功能特点
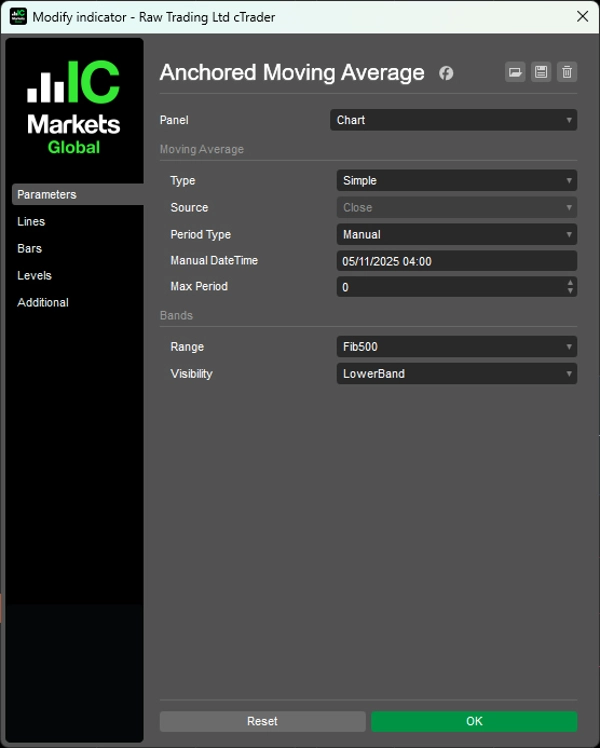
时间锚定计算
- 不同于使用固定周期的标准移动平均线,此指标从您选择的起点自然增长
- 灵活锚定:设置手动日期时间或使用预定义的回溯期(1小时至10年)
- 跟踪重要市场时刻的动量
- 不同时间框架下保持一致的锚点
自适应斐波那契带
- 基于实际价格范围自动计算的带,而非任意ATR倍数
- 8个斐波那契水平(11.4%至100%)适应真实价格变动
- 均值回归区:内置38.2%-62.8%回归区,提供高概率入场区域
- 数学定义的概率区域
两种移动平均类型
- 简单移动平均线
- 指数移动平均线
- 最大周期限制:防止长时间框架上的过度平滑
多种显示模式
- 完整带:显示所有斐波那契水平
- 仅上下边界:显示极限边界
- 仅回归区:聚焦均值回归区域
- 简洁且有目的的设计,无杂乱
基于事件的分析
- 查看当前价格与重要水平变动的关系
- 跟踪事件后的价格行为
- 基于结构的入场,具有明确的参考点
__________________________________________________________________________________________
更多免费指标
探索广泛的市场分析工具——从结构和成交量到回归、波动率及自定义时间框架。
源代码可在GitHub 仓库获取。
全部免费使用。但如果您愿意支持咖啡费用,可以通过 这里捐助。
支撑/阻力
成交量
移动平均线
实用工具/自定义
基于回归
波动率
振荡器
__________________________________________________________________________________________
免责声明
交易存在风险。此指标仅用于技术分析——请始终应用适当的风险管理并负责任地交易。
反馈与改进
如果您有建议、功能请求或改进想法,请在讨论标签中留言。您的反馈有助于为所有人改进此指标。
摘要
客户评价
5 | 100 % | |
4 | 0 % | |
3 | 0 % | |
2 | 0 % | |
1 | 0 % |