
说明
概述
成交量扩散分析(VSA)是一种由前辛迪加交易员Tom Williams基于20世纪初Richard Wyckoff的工作开发的方法论。VSA通过解释成交量、价格区间(波动范围)和收盘位置之间的关系,识别供需失衡。
VSA关键概念:
- 成交量 显示活动量 - 谁在参与
- 区间 显示波动性和不确定性 - 价格移动的幅度
- 收盘位置 显示该柱谁获胜 - 买方还是卖方
- 背景 显示我们在市场周期中的位置 - 强势或弱势阶段
当成交量增加且区间宽但价格进展不大时,表明吸收(单方吸收另一方压力)。当成交量减少且区间窄时,表明参与度不足(潜在弱势)。
本实现:
该指标使用统计方法量化VSA概念。与传统VSA有几个不同之处:
- 使用
(close - open) / range作为效率指标(原始VSA中无此项) - 吸收模式识别为“单方获胜”,而非传统的“压力吸收”
- ENR(无效努力)通过效率阈值量化;原始VSA更具解释性
- 使用修剪均值进行成交量平均(抗异常值)和百分位排名进行区间评估
- 不包括:停止成交量、上推、测试、震荡模式
这是一种量化的算法方法来处理VSA概念。传统VSA更具解释性和依赖上下文。将此指标作为众多分析工具之一使用,而非独立信号。
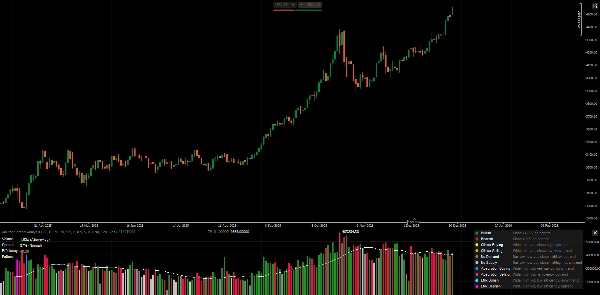
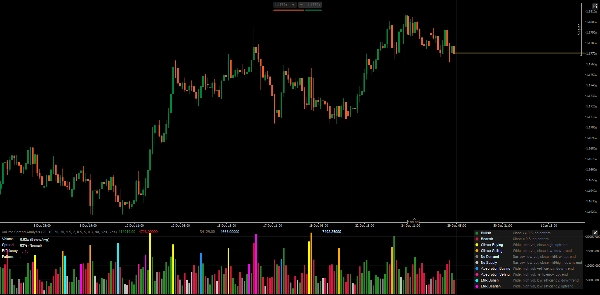
该指标功能
分析每根柱的成交量、区间和收盘位置以检测潜在的供需失衡。显示按模式类型着色的成交量直方图,并带有实时指标面板。
模式定义
1. 标准柱(无模式)
- 看涨: 收盘≥区间0.5,无特殊模式检测
- 看跌: 收盘<区间0.5,无特殊模式检测
2. 高潮模式(潜在耗尽)
- 高潮买入: 宽区间 + 超高成交量 + 高收盘 + 上升趋势中
-
- 解释:可能买入耗尽,注意反转
- 高潮卖出: 宽区间 + 超高成交量 + 低收盘 + 下降趋势中
-
- 解释:可能卖出耗尽,注意反转
3. 弱势模式(缺乏信心)
- 无需求: 窄区间 + 低成交量 + 中低收盘 + 上升趋势中
-
- 解释:买方未支持上涨,潜在弱势
- 无供应: 窄区间 + 低成交量 + 中高收盘 + 下降趋势中
-
- 解释:卖方未推动下跌,潜在强势
4. 吸收模式(单方获胜)
- 吸收买入: 宽区间 + 高成交量 + 正效率 + 下降趋势中
-
- 解释:买方吸收卖压,潜在反转向上
- 吸收卖出: 宽区间 + 高成交量 + 负效率 + 上升趋势中
-
- 解释:卖方吸收买压,潜在反转向下
5. ENR模式(无明确结果的努力)
- ENR看涨: 宽区间 + 高成交量 + 低效率 + 下降趋势中
-
- 解释:高努力但无明确赢家,潜在支撑/犹豫
- ENR看跌: 宽区间 + 高成交量 + 低效率 + 上升趋势中
-
- 解释:高努力但无明确赢家,潜在阻力/犹豫
指标面板说明
成交量
- 显示当前柱成交量与修剪均值的比率(例如,“1.85倍”)
- 分类:低 / 低于平均 / 高于平均 / 高 / 超高
- 高成交量 = 市场参与度,但需考虑背景
区间
- 显示相对于近期柱的百分位排名(0-100%)
- 分类:窄 / 正常 / 宽
- 宽区间 = 波动性/不确定性,不一定指方向
效率
- 公式:
(close - open) / (high - low) - 范围:-1.0 到 +1.0
- 正值 = 看涨实体主导区间
- 负值 = 看跌实体主导区间
- 接近零 = 小实体,高影线,犹豫不决
模式
- 当前检测到的模式(无则显示“-”)
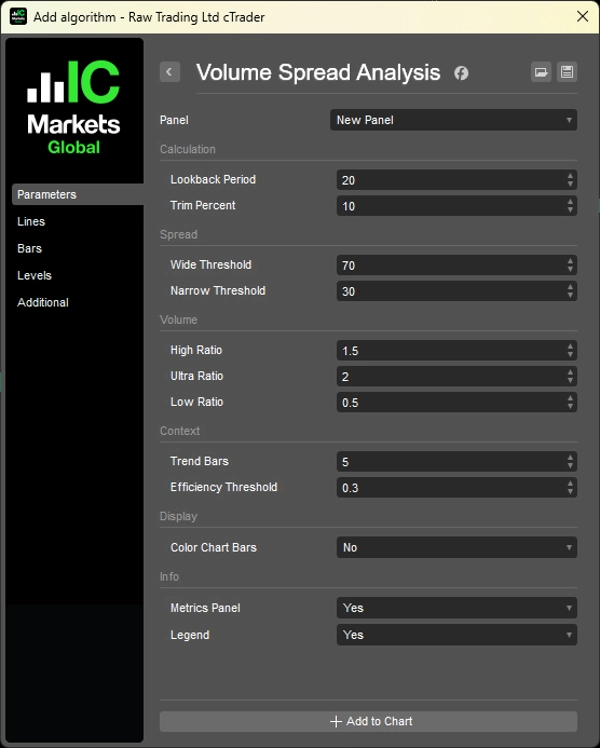
参数
1. 计算
- 回溯周期 (20):用于成交量/区间统计的柱数
- 修剪百分比 (10%):从成交量计算中移除异常值
2. 区间分类
- 宽阈值 (70%):分类为“宽”的百分位
- 窄阈值 (30%):分类为“窄”的百分位
3. 成交量分类
- 高比率 (1.5倍):高于平均阈值
- 超高比率 (2.0倍):超高阈值
- 低比率 (0.5倍):低于平均阈值
4. 背景
- 趋势柱数 (5):用于比较趋势方向的柱数
- 效率阈值 (0.3):判定“强”效率的最低值
5. 显示
- 图表柱颜色:将模式颜色应用于价格图表
- 指标面板:显示实时指标
- 图例:显示模式参考指南
使用方法
1. 不要将模式用作直接交易信号 - 它们指示潜在背景,而非入场点。
2. 结合价格结构使用 - VSA最适合确认价格结构所显示的内容。
3. 注意背景 - 同一模式在支撑位和阻力位可能含义不同。
4. 成交量视角很重要 - 关键水平的高成交量吸收 > 随机柱吸收。
外汇成交量限制
外汇现货市场显示 成交量刻度(价格变动次数),而非实际交易合约数量。模式可能不如期货/股票中基于真实成交量数据的可靠。
图例(内置参考)
启用“图例”参数以在图表上直接显示模式描述。
__________________________________________________________________________________________
更多免费指标
探索广泛的市场分析工具——从结构和成交量到回归、波动率和自定义时间框架。
源代码可在GitHub 仓库获取。
全部免费使用。但如果您愿意支持咖啡费用,可以通过 这里捐赠。
支撑/阻力
成交量
移动平均线
实用工具/自定义
基于回归
波动率
振荡器
__________________________________________________________________________________________
免责声明
交易存在风险。此指标仅用于技术分析——请始终应用适当的风险管理并负责任地交易。
反馈与改进
如果您有建议、功能请求或改进想法,请在讨论标签中留言。您的反馈有助于提升该指标,造福所有用户。
摘要
This implementation quantifies VSA concepts using statistical methods, including an efficiency metric defined as (close - open) / range, trimmed mean volume averaging, and percentile ranking for spread. It identifies several bar patterns: Standard (bullish/bearish), Climax (buying/selling exhaustion), Weak (No Demand/No Supply), Absorption (one side winning), and ENR (Effort No Result), each indicating different market conditions.
The indicator displays a volume histogram colored by detected pattern type and provides a real-time metrics panel showing volume ratio, spread percentile, efficiency, and current pattern. Parameters allow customization of lookback periods, volume/spread thresholds, and display options such as coloring chart bars and showing a pattern legend.
VSA is applicable across markets including Forex, stocks, indices, commodities, and crypto. Note that Forex volume reflects tick volume, which may affect pattern reliability. The indicator is designed as an analytical tool to complement price structure analysis rather than as standalone trade signals.
客户评价
5 | 100 % | |
4 | 0 % | |
3 | 0 % | |
2 | 0 % | |
1 | 0 % |


