
说明
指数猎人:概述
指数猎人是一种专门的技术指标和决策支持系统,主要针对高波动性的指数,如 US30(道琼斯) 和 NAS100(纳斯达克)。与仅显示历史数据的标准指标不同,指数猎人专注于 “向量预测”——尝试基于多个时间框架的当前速度(斜率)预测未来4根蜡烛的价格位置。
1. 核心机制(工作原理)
A. “向量”预测引擎
这是工具的核心。它不仅仅观察当前价格;它计算 变化率(斜率) 在M5、M15和H1时间框架上,以在图表上绘制“未来路径”。
- 机制: 它计算不同时间框架动量的加权平均值,预测未来4个点(P1、P2、P3、P4)。
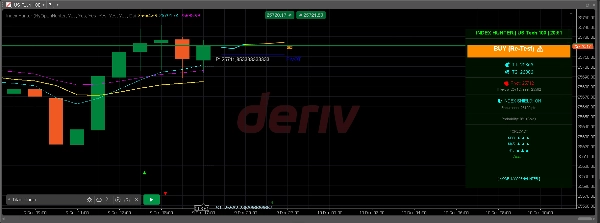
- 视觉效果: 你会看到一个彩色路径(青色 -> 黄色 -> 橙色)延伸到价格右侧,形象展示市场惯性。
- 幽灵路径: 它还会记住 之前的 预测(幽灵路径),以便你查看市场是否尊重算法的过去预测(“现实检查”)。
B. 多层视觉系统
它自动叠加关键的机构水平:
- 枢轴点(灵活): 基于可选时间框架(H12、每日、Day2或Day3)自动计算枢轴点、R1/S1和R2/S2水平。
- 心理水平: 在每100点间隔(如34000、34100)绘制“心理线”,这些通常是指数的磁性区域。
- 每日高低: 标记前一日的区间,显示突破或拒绝区域。
- 分形: 用箭头(▲ ▼)标识局部顶部和底部,便于精确入场/止损设置。
C. “信心”与可行性逻辑
该工具不仅给出信号,还对其进行评分。
- 计算: 测量到你的利润目标的距离,并与市场当前能量(ATR - 平均真实波幅)进行比较。
- 输出:
-
- 热(>80%): 强劲动量 + 合理目标距离。
- 温(50-80%): 中等设置。
- 冷(<50%): 市场认为达到目标的概率低(例如,目标距离当前波动性过远)。
D. 账户“护盾”机制
面板上包含一个被动风险管理器:
- 耐力指标: 根据你的余额和最小手数,计算市场可以反向移动多少“点”才会使账户处于危险状态。
- 状态: 如果账户相对于当前波动性(ATR)安全,则显示“🛡️ 指数护盾:开启”,如果波动性对余额过高,则显示“⚠️ 保证金不足”。
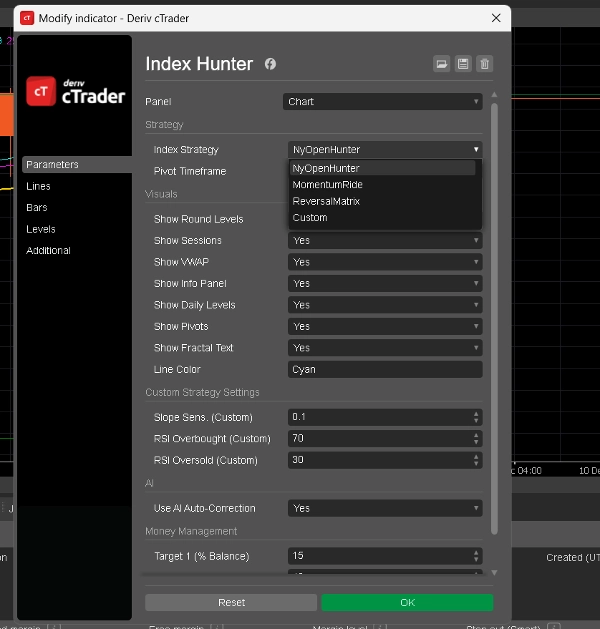
2. 可用模式(策略)
你可以在指标设置中切换这些模式(
指数策略
参数)。每种模式改变AI对市场的解读方式。
1. 模式:NyOpenHunter(纽约剥头皮)
- 最佳适用: 美国市场开盘的混乱前2-3小时。
- 逻辑:
-
- 活跃时间: 13:00 - 17:00 UTC(大约)。
- 触发条件: 寻找M5斜率大于 0.1 (或小于-0.1)。
- 理念: “捕捉爆发。” 它等待纽约钟声时的初始成交量爆发,并发出信号跟随那波特定浪潮。
- 面板情绪: 显示“纽约开盘买入 🚀”或“纽约开盘卖出 🔻”。
2. 模式:MomentumRide(趋势跟随)
- 最佳适用: 开盘之外的强劲、持续趋势。
- 逻辑:
-
- 触发条件: 需要一个 更强 的M5斜率(> 0.2)比纽约模式更高。
- 理念: “不要被震荡砍掉。” 它忽略弱势波动,仅在市场有显著信念时发出信号。
- 面板情绪: 显示“动量上升 🟢”或“动量下降 🔴”。
3. 模式:ReversalMatrix(反趋势)
- 最佳适用: 震荡市场或捕捉顶部/底部。
- 逻辑:
-
- 触发条件: 使用RSI(相对强弱指数)。
-
- 卖出信号: RSI > 75(超买)。
- 买入信号: RSI < 25(超卖)。
- 理念: “反转极端。” 它识别橡皮筋被拉得过远,可能会反弹回来的时机。
- 面板情绪: “超买(即将卖出)”或“超卖(即将买入)”。
4. 模式:自定义(用户定义)
- 最佳适用: 希望调整机器人的高级用户。
- 逻辑: 允许你在设置中自行设定 斜率灵敏度 和 RSI水平。
-
- 示例: 你可以创建一个混合策略,仅当斜率 > 0.05 且 RSI < 40 时买入。
3. “信息面板”(抬头显示)
图表右侧的视觉面板整合了所有这些数据:
- 标题: 显示当前模式和符号。
- 偏好: 主要AI偏向(例如,“买入34150 ▲”)。
- 目标(T1,T2): 基于你的账户百分比设置和波动性计算的动态利润目标。
- 预测: 对M30、M45和H1趋势的连续分析(例如,“M30: ▲ ▲ ▲”表示强买入一致)。
- 概率: AI的信心评分(热/温/冷)。
摘要
AI 摘要
Index Hunter is a technical indicator designed for momentum analysis on high-volatility US indices, specifically US30 (Dow Jones) and NAS100 (Nasdaq). It projects price movement four candles into the future by calculating a weighted average of momentum (slope) across multiple timeframes (M5, M15, H1), visualizing this as a colored "Future Path" on the chart. The indicator also retains the previous prediction as a "Ghost Path" for comparison.
Key features include an automatic overlay of institutional levels such as pivot points (with selectable timeframes), psychological price levels at 100-point intervals, previous day’s high/low, and fractals marking local tops and bottoms. It incorporates a confidence grading system (Hot, Warm, Cold) based on momentum strength and volatility relative to profit target distance.
Index Hunter includes a risk management "Shield" that assesses account safety by calculating potential adverse market moves against account balance and lot size, displaying status alerts accordingly.
The indicator offers four operational modes: NyOpenHunter (New York market open scalping), MomentumRide (trend following), ReversalMatrix (counter-trend using RSI), and a Custom mode for user-defined slope and RSI thresholds. A comprehensive info panel consolidates mode, bias, dynamic targets, trend forecasts, and confidence scores for decision support.
指标配置
客户评价
4.6
评价:3
5 | 67 % | |
4 | 33 % | |
3 | 0 % | |
2 | 0 % | |
1 | 0 % |
客户评价
December 22, 2025
Index Hunter is a solid momentum and trend filter designed with indices in mind. Fast, stable and easy to read, it helps avoid choppy phases and stay aligned with strong moves. Best used as confirmation, especially for intraday index trading.
December 20, 2025
the best part is the trader gets a second pause before entry. Risk rules still need to stay visible.
December 19, 2025
The cleanest use is it helps the plan stay realistic. Overconfidence is the real danger.
讨论
常见问答
Forex
Signal
Breakout
ZigZag
Scalping
Indices
Supertrend
AI
NAS100
ATR
VWAP
cTrader Store 提供的所有产品,包括交易机器人、指标和插件,均由第三方开发者提供,仅供信息参考和技术访问之用。cTrader Store 并非经纪商,不提供投资建议、个人推荐或任何未来业绩保证。


价格
注册日期 08/11/2025
23
销售
59
免费安装