
RT Qualitative Quantity Estimation
指标
1 购买
版本 1.0, Sep 2024
Windows 版、Mac 版
说明
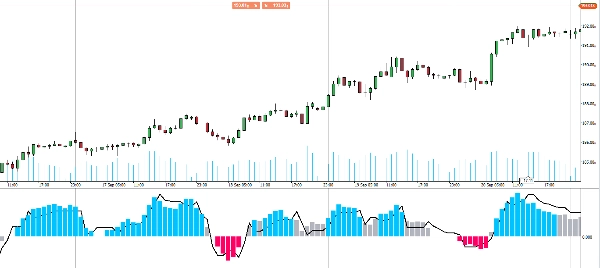
介绍先进的 QQE(定性定量估计)指标,这是一种强大的工具,结合了两个 QQE 指标,以增强交易洞察力。
一个 QQE 以柱状图形式显示在图表上,另一个在后台运行,使用 50 周期的布林带作为零线。
这种设置使您能够直观地评估市场动量并清晰地识别潜在的入场点。当两个 QQE 指标一致时,您会看到清晰的蓝色或红色柱,表示强烈的买入或卖出机会。
使用 QQE 指标提升您的交易策略,以便做出更明智的决策并提高市场分析的准确性。
摘要
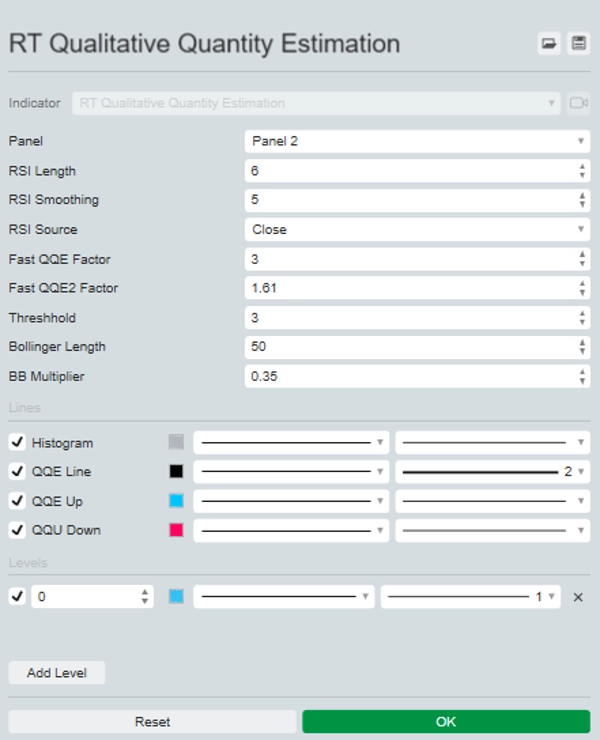
指标配置
客户评价
0.0
评价:0
客户评价
该产品尚无评价。已经试过了?抢先告诉其他人!
讨论
常见问答
BTCUSD
Forex
Signal
Indices
EURUSD
Commodities
GBPUSD
NZDUSD
Crypto
Stocks
XAUUSD
NAS100
USDJPY
cTrader Store 提供的所有产品,包括交易机器人、指标和插件,均由第三方开发者提供,仅供信息参考和技术访问之用。cTrader Store 并非经纪商,不提供投资建议、个人推荐或任何未来业绩保证。


价格
注册日期 25/09/2024
20
销售