Trading product for Waddah Attar Explosion 指标 Breakout, image 1
指标
141 下载
版本 1.1, Jan 2026
Windows 版、Mac 版
Trading product for Waddah Attar Explosion 指标 Breakout, image 2
Trading product for Waddah Attar Explosion 指标 Breakout, image 3
Trading product for Waddah Attar Explosion 指标 Breakout, image 4
Trading product for Waddah Attar Explosion 指标 Breakout, image 5
注册日期 20/12/2024
7.61K
免费安装

概述


Waddah Attar 爆炸(WAE)指标由 Ahmad Waddah Attar 创建,并于2007年向交易社区介绍。它结合了MACD动量测量与布林带波动性分析,以识别“价格爆炸”时刻——价格从盘整转向强烈方向性运动的阶段。

该指标回答两个问题:

  • 动量是否在积聚?(通过MACD变化率测量)
  • 波动性是否在扩展?(通过布林带宽度测量)

当两个条件都超过噪声过滤器(死区)时,表示潜在的爆发性走势信号。
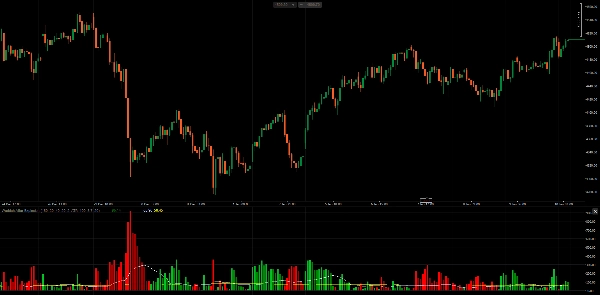
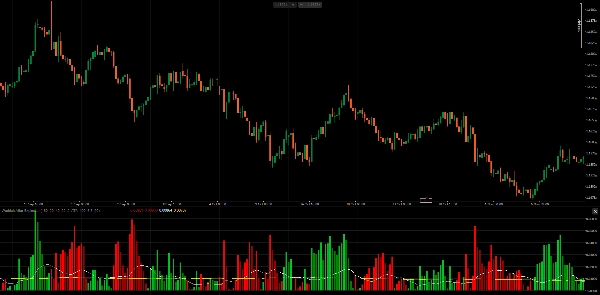

组成部分


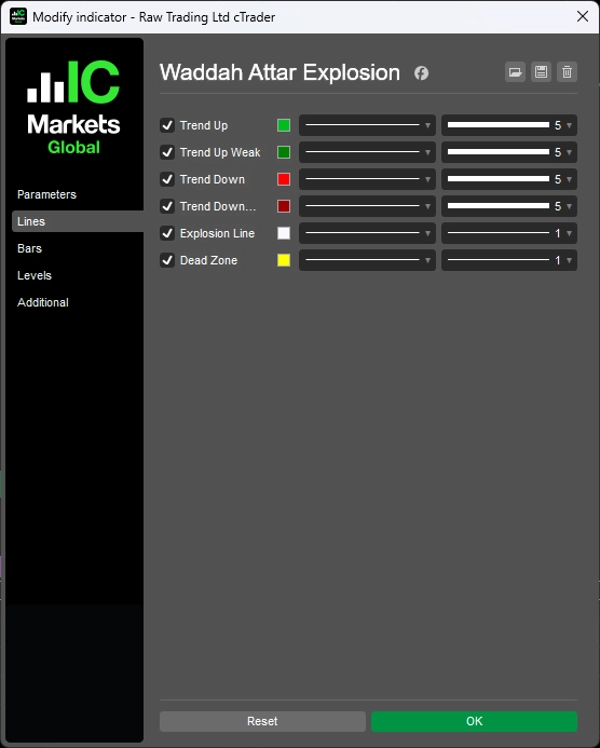
1. 趋势柱状图(绿色/红色) 显示MACD线的变化率,乘以灵敏度因子。

  • 计算方式: (MACD_current - MACD_previous) × Sensitivity
  • 绿色柱: 看涨动量(MACD向上加速)
  • 红色柱: 看跌动量(MACD向下加速)
  • 亮色: 动量较前一柱增加
  • 暗色: 动量较前一柱减少

2. 爆炸线(白色) 表示布林带的宽度,指示波动性的扩展或收缩。

  • 计算方式: BB_Upper - BB_Lower
  • 上升: 波动性扩展(潜在突破)
  • 下降: 波动性收缩(盘整)

3. 死区(黄色) 阈值过滤器,用于消除市场噪声引起的弱信号。

  • 基于ATR: 适应当前市场波动性
  • 固定点差: 静态阈值


Ahmad Waddah Attar 的使用方法


根据原作者:

买入入场规则 必须满足所有条件:

  • 绿色柱状图上升
  • 绿色柱状图高于爆炸线
  • 爆炸线在上升
  • 绿色柱状图和爆炸线均高于死区

卖出入场规则 必须满足所有条件:

  • 红色柱状图上升
  • 红色柱状图高于爆炸线
  • 爆炸线在上升
  • 红色柱状图和爆炸线均高于死区

退出规则

  • 当绿色柱状图跌破爆炸线时退出多头
  • 当红色柱状图跌破爆炸线时退出空头

关键见解 爆炸线的角度很重要。当爆炸线向上倾斜且柱状图突破其上方时,确认波动性正在积极增加——“爆炸”是真实的,而非假信号。
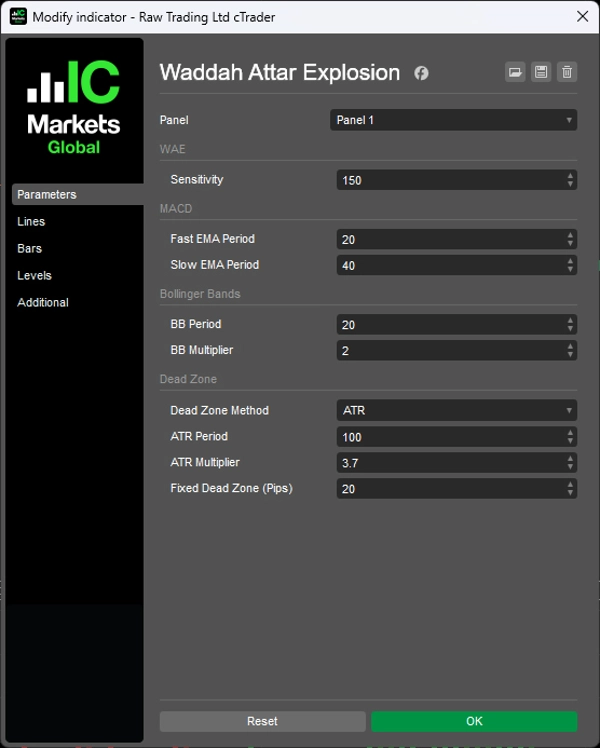

参数


1. 灵敏度

  • 灵敏度 (150):MACD变化率的乘数

2. MACD

  • 快速EMA周期 (20):MACD计算的快速移动平均
  • 慢速EMA周期 (40):MACD计算的慢速移动平均

3. 布林带

  • 布林带周期 (20):布林带回溯周期
  • 布林带乘数 (2.0):标准差乘数

4. 死区

  • 死区方法 (ATR):在基于ATR或固定点差之间选择
  • ATR周期 (100):ATR计算周期
  • ATR乘数 (3.7):应用于ATR的死区乘数
  • 固定死区 (20):死区点差值(使用固定方法时)


注意事项

  • 该指标适用于所有时间框架。原作者推荐使用H1和M30。
  • 建议使用基于ATR的死区,因为它能适应不同的工具和市场条件。
  • 灵敏度参数可能需要根据时间框架和工具波动性进行调整。
  • 该指标识别动量和波动性的一致性——它本身不预测方向。建议结合趋势分析或支撑/阻力位使用。


__________________________________________________________________________________________


更多免费指标


探索各种市场分析工具——从结构和成交量到回归、波动性和自定义时间框架。

源代码可在GitHub 仓库获取。

全部免费使用。但如果您愿意支持咖啡,可以通过 这里捐赠。


支撑/阻力


成交量


移动平均线


实用工具/自定义


基于回归


波动性


振荡器


__________________________________________________________________________________________


免责声明

交易涉及风险。该指标仅用于技术分析——请始终应用适当的风险管理并负责任地交易。


反馈与改进

如果您有建议、功能请求或改进想法,请在讨论标签页留言。您的反馈有助于为所有人改进该指标。

指标配置
0.0
评价:0
客户评价
该产品尚无评价。已经试过了?抢先告诉其他人!
Breakout
cTrader Store 提供的所有产品,包括交易机器人、指标和插件,均由第三方开发者提供,仅供信息参考和技术访问之用。cTrader Store 并非经纪商,不提供投资建议、个人推荐或任何未来业绩保证。

该作者的其他作品

指标
VWAP
Customizable VWAP with flexible reset, three band methods, and full Fibonacci level control.
指标
Fibonacci
Fair Value Gap
Detect FVGs with age, status, Fibonacci levels, and customizable fill threshold—extended version.
指标
Fibonacci
Clear pivot levels. Clean S/R zones. Five methods. Any timeframe.
指标
Forex
Crypto
+3
Volume distribution analysis with Market Profile TPO integration.
指标
Forex
Crypto
+3
Custom and native timeframes display with OHLC lines, moving averages, and Fibonacci levels.
指标
Forex
Crypto
+3
VSA indicator analyzing volume, spread, and close location to detect supply/demand imbalances.
指标
Breakout
Fibonacci
Track Initial Balance ranges across any period with optional Fibonacci levels and projections.
指标
Forex
Crypto
+3
28-method MA library in one indicator — from classic EMAs to adaptive & zero-lag variants.
指标
Breakout
Plots automatic psychological levels at round-number zones – major structure & liquidity levels.
指标
Breakout
Fibonacci
Statistically-grounded trend channels via linear regression — clear trend & reversal zones.
指标
Forex
Crypto
+3
John Ehlers' trendline using signal processing to filter cycle noise and identify trends with minimal lag.
指标
Forex
Crypto
+3
Volume profiler applying Wyckoff effort vs result and spread analysis with visual bar graphs.

猜您喜欢

指标
ATR
Volume
+1
The UT Bot identify potential trend reversals and momentum shifts.
指标
Prop
Forex
+3
Price Change Bundle 3-in-1 Levels • Bars • Histogram. Secret of Price Change
指标
Key Levels
Supply & Demand
+2
Institutional Levels Pro is an essential tool for traders who rely on price action and institutional market structure.
指标
VWAP
Volume
+5
The MA Quant Volume Profile Custom Range is a trading indicator that analyzes volume distribution across the price.
指标
AI
Forex
+7
Signal Strike is a professional trading indicator delivers clear, high‑confidence entry signals directly on your chart
指标
VWAP
Volume
+4
Volume Profile + VWAP with Standard Deviations
指标
EMA
RSI
+5
MACD Colour Histogram with 11 Moving Average Types, Multi-timeframe confirmation and Sound Signal Alert.
指标
ATR
Fibonacci
+3
PathoBox non-repainting Fibonacci indicator for accurate support, resistance, entry, and target levels.
指标
Prop
VWAP
+12
FBX VWAP Anchored — Professional VWAP
指标
Order Block Detector is built to spot and display Order Blocks on chart, often triggering strong price reactions.
指标
Imbalance
Supertrend
+5
Colorea las velas automáticamente según los niveles máximos, mínimos y de cierre previos para definir tendencias.
指标
AI
ATR
+10
FX Sniper: Multi-pair Forex analysis tool. Features trend logic, adaptive pivots, and momentum filtering for major pairs
指标
This indicator is a valuable tool for traders looking to identify significant opening price level of any asset.
指标
ADX
ATR
+5
10 Factors. One Signal. Zero Guesswork.
指标
Prop
Forex
+9
Average Cost Price helps you keep track of your open positions on the chart. In doing so, it provides lines and explanat
指标
RSI
VegaXLR's cTrader StochRSI identifies overbought/oversold RSI levels for precise trade entries.
指标
RSI
Signal
+1
🚀📈 Plot buy/sell signals on Range Bars using Moving Averages and RSI. Clear, actionable trading insights.🚀📈
指标
AI
SMC
+18
ICT HTF Candles- The Ultimate Multi-Timeframe Dashboard Stop switching timeframes and losing focus.
注册日期 20/12/2024
7.61K
免费安装