
Descrição
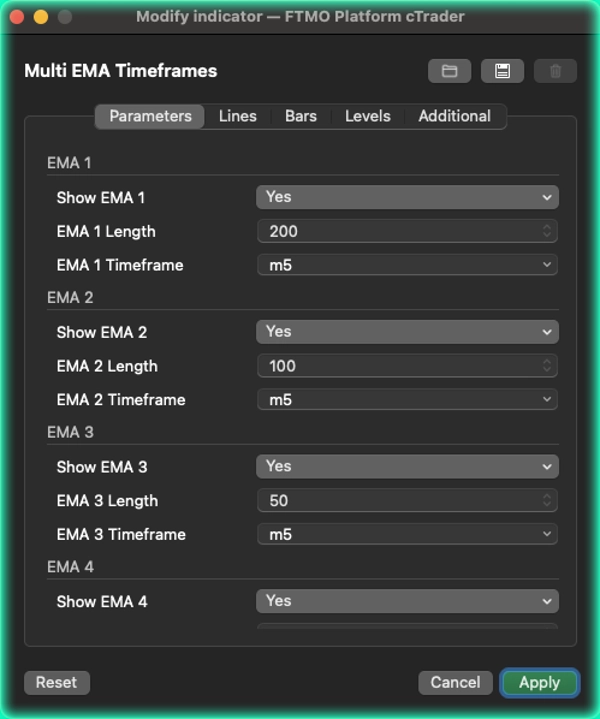
Multi EMA Timeframes by [BeyondTrading] O erro mais comum que os traders cometem com médias móveis é mudar de timeframe apenas para verificar onde uma EMA chave está posicionada. Multi EMA Timeframes elimina isso completamente. Você permanece no seu timeframe de trabalho — seu de 5 minutos, seu de 15 minutos, seu de 1 hora — e define exatamente qual EMA de qual timeframe deve aparecer no seu gráfico, agora mesmo, sem precisar mudar de lugar.
Você está no gráfico de 5 minutos e quer ver a EMA 200 do horário? Feito. Também quer a EMA 50 do de 15 minutos e a EMA 20 do timeframe atual lado a lado? Também feito. Cada uma das cinco EMAs é configurada completamente de forma independente: seu próprio período, seu próprio timeframe de origem, sua própria cor e seu próprio botão de ligar/desligar.
Isso é particularmente poderoso para configurações de confluência. Quando o preço no seu timeframe de entrada se aproxima de uma EMA que pertence a um timeframe muito maior, esse nível carrega um peso estrutural real. Vê-lo diretamente no seu gráfico — sem trocar de aba, sem duvidar do valor exato — muda a forma como você interage com essas zonas chave.
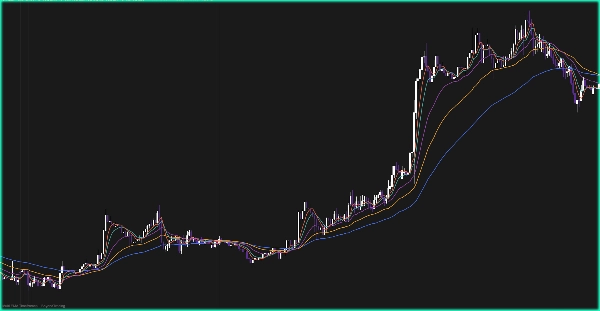
Dois modos de renderização permitem que você controle como as linhas são desenhadas. O modo Step congela cada EMA na última barra de origem totalmente fechada, então o valor nunca muda até que a barra do timeframe maior feche — zero repintura, totalmente confiável para decisões de trading ao vivo. O modo Smooth interpola continuamente entre as barras de origem para um visual mais limpo, mais adequado para análise e revisão.
O que o torna diferente A maioria dos indicadores multi-EMA calcula tudo no timeframe atual do gráfico. Aqui, cada EMA é genuinamente originada do seu próprio timeframe independente. Você não está aproximando — você está lendo a EMA real que os traders naquele timeframe realmente veem.
Recursos
- Até 5 EMAs totalmente independentes, cada uma com seu próprio timeframe e período
- Permaneça em qualquer timeframe de gráfico enquanto lê EMAs de qualquer outro timeframe
- Modo Step: valores travados nas barras de origem fechadas, sem repintura
- Modo Smooth: interpolação linear para transições visuais fluidas
- Botão de mostrar/ocultar por EMA para manter seu gráfico sempre limpo
Resumo
Avaliações de clientes
5 | 50 % | |
4 | 50 % | |
3 | 0 % | |
2 | 0 % | |
1 | 0 % |


