
설명
[BeyondTrading]의 세션 — 시장이 어디에 있었는지 알아보세요.
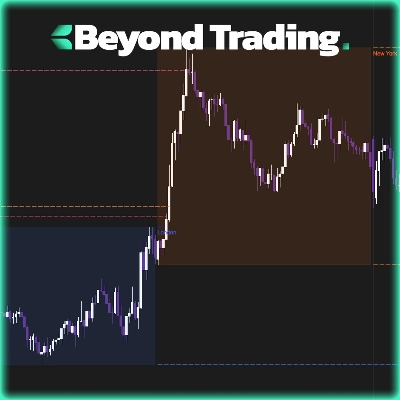
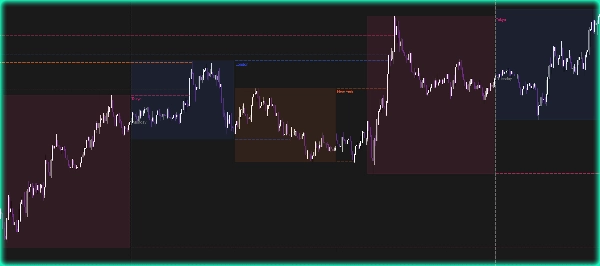
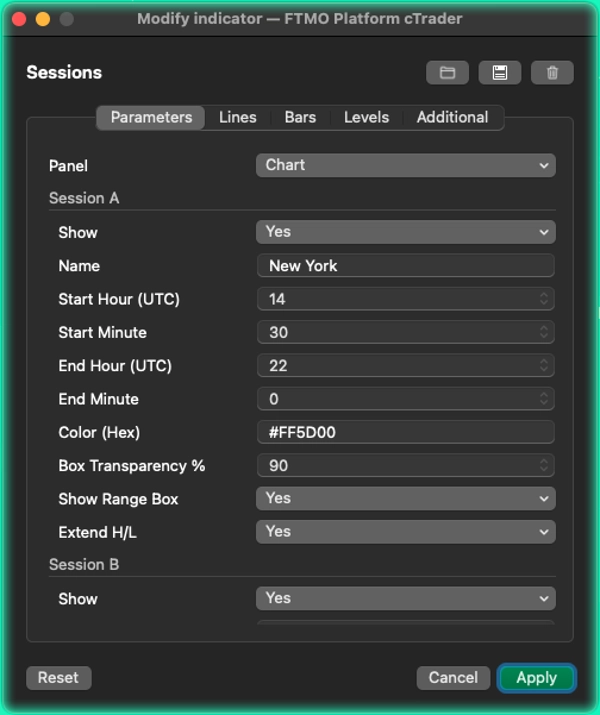
차트에서 4대 주요 거래 세션을 직접 시각화하세요 — 뉴욕, 런던, 도쿄, 시드니 — 색상, 시간, 투명도를 완전히 사용자 지정할 수 있습니다. 각 세션은 가격이 움직일 때 실시간으로 확장되는 라이브 범위 상자를 그려 항상 구축 중인 범위를 알 수 있습니다.
세션이 종료되면 고가와 저가가 자동으로 점선으로 앞으로 투영됩니다. 이 수준들은 가격이 돌파할 때까지 활성 상태를 유지하며, 그 후에는 멈춥니다. 혼란도 없고 추측도 없습니다. 어떤 수준이 아직 활성 상태이고 어떤 수준이 제거되었는지 정확히 볼 수 있습니다.
세션 고가/저가 수준이 중요한 이유
세션의 고가와 저가는 주요 유동성 풀입니다. 기관과 시장 조성자들은 실제 움직임 전에 반전하거나 유동성을 확보하기 위해 지속적으로 이 수준으로 돌아옵니다. 이전 런던 고가는 단순한 선이 아니라, 스톱 주문이 위치한 곳이며, 돌파 트레이더가 갇혀 있는 곳이고, 스마트 머니가 반전 전에 사냥을 하는 곳입니다. 자동 확장과 즉각적인 돌파 감지 기능으로 어떤 수준이 아직 유효하며 반응을 유발할 가능성이 있는지 항상 알 수 있습니다.
기능
- 시작/종료 시간, 16진수 색상, 투명도를 사용자 지정할 수 있는 4개의 완전 구성 가능한 세션.
- 모든 바에서 업데이트되는 라이브 범위 상자.
- 세션 종료 후 앞으로 투영되는 고가와 저가, 돌파 시 자동 제거.
- 차트를 깔끔하게 유지하기 위한 최대 활성 수준 구성 가능.
- 요일 레이블이 있는 일일 수직 구분선.
- 시드니와 같은 야간 세션과도 작동.
요약
AI 요약
Sessions by BeyondTrading is a chart indicator that visualizes the four major global trading sessions: New York, London, Tokyo, and Sydney. Each session is displayed with customizable colors, start/end times, and transparency settings. The indicator draws a live range box for each session that expands in real time as price moves, providing a clear view of the session's price range.
After a session closes, the session's High and Low levels are automatically projected forward as dashed lines. These levels remain active until the price breaks through them, at which point they are removed, helping traders identify live breakout points without clutter. The indicator supports configurable maximum active levels to maintain chart clarity and includes a daily vertical divider labeled with the day of the week.
Designed to work with overnight sessions like Sydney, this tool highlights key liquidity zones where institutional traders often act. It is applicable across multiple markets including Forex, indices, commodities, cryptocurrencies, and stocks. The indicator aids in recognizing important breakout and reversal levels based on session highs and lows, facilitating informed trading decisions.
지표 프로필
상담
고객 리뷰
5.0
리뷰: 4
5 | 100 % | |
4 | 0 % | |
3 | 0 % | |
2 | 0 % | |
1 | 0 % |
고객 리뷰
April 14, 2026
The product earns time when the journal has a cleaner path. Risk control still needs review the setup.
April 12, 2026
Low quality trades are less tempting, but it can look better than it is during a lucky run.
자주 묻는 질문(FAQ)
Prop
Forex
Breakout
Indices
Commodities
Crypto
Stocks
트레이딩 봇, 지표, 플러그인 등 cTrader Store에서 제공되는 상품은 제3자 개발자에 의해 제공되며, 이는 단순히 정보 및 기술적 접근을 목적으로 제공된 것입니다. cTrader Store는 중개인이 아니며, 투자 조언, 개인별 추천 또는 향후 성과에 대한 어떠한 보장도 제공하지 않습니다.
이 작성자의 상품 더 보기






가격
가입일 21/01/2026
6
판매
255
무료 설치