Description
Launch price: $19 until November 14, 2026. After that date, the price returns to $33.
A clean chart, with nothing important hiding on the left
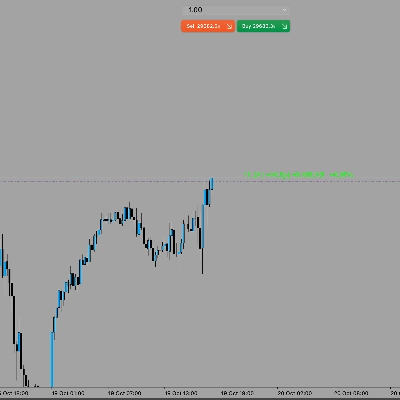
PulseFlow Imbalance Sessions and ADR keeps the structure that matters in front of you: open imbalance zones (fair value gaps), untouched session highs and lows, and how far the day has travelled against its average range. You read the chart at a glance, without dragging it back in time. It helps you make better decisions with clear references.
The zone you needed, lost to the left
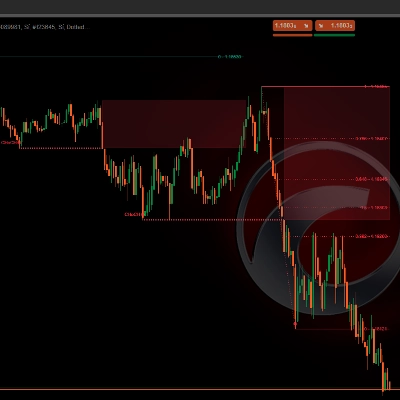
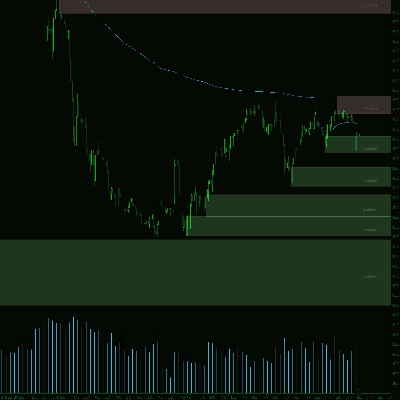
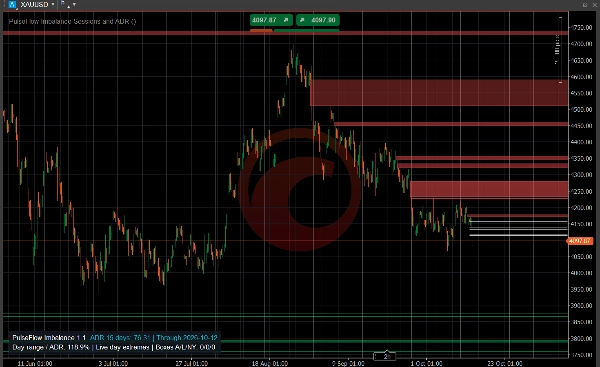
A fast move leaves an imbalance behind. By the time price comes back, it can be far off screen, and you wonder whether it was ever filled. Here, open zones stay in view until price fills them.
Only what is still open
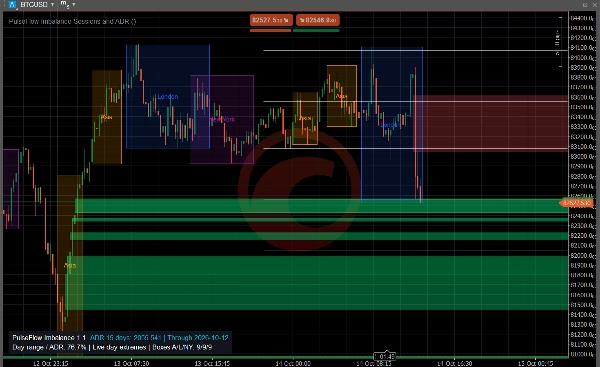
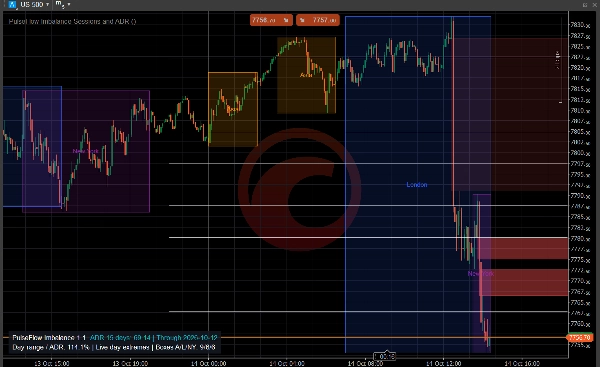
- Bullish zones in green, bearish zones in red, extended to the right.
- Gaps that are small compared with the average daily range (ADR) are ignored, so only meaningful zones are drawn.
- A zone shrinks live as price trades back into it and disappears once it is completely filled.
- The shade of each zone shows the volume behind the move that created it: darker when volume was low, brighter when it was high. Volume comes from cTrader tick volume.
The map of the day
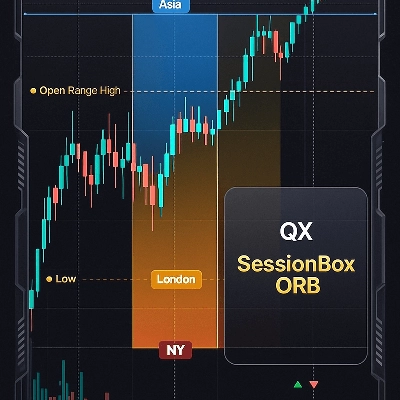
- Boxes mark the Asia (Tokyo), London and New York sessions, each in its own colour.
- Dotted lines stay at the high and low of each finished session until price touches them.
- ADR projections at 50%, 75% and 100% of the average daily range, measured from the day's low and high or from the day open, show how much room the day has used.
- A compact panel shows the current ADR and the share of it the day has already covered.
Then the reading is yours
Watch what price does when it returns to an open zone or a session level: pause, rejection or a full fill. Optional cTrader pop-up alerts tell you about new imbalances, large imbalances relative to the ADR, first touches, partial fills and complete fills, so you can step away from the screen.
Type, instruments and timeframes
Chart overlay indicator for market structure: imbalance zones, session levels and daily range projections. It works on any market with candles, such as stock indices, forex, gold and cryptocurrencies. Imbalance zones work on all standard time-based charts. Session boxes need an intraday chart and read best up to the 1-hour chart. ADR projections are available on intraday and daily charts. Tick, Renko, range and Heikin Ashi charts are not supported.
Keep in mind
Zones are drawn when the third candle closes, after the move, never ahead of it. Sessions are clock windows without a holiday calendar and can be switched off. The ADR is an average of completed days, not a limit price must respect. Zones and levels are references, not entries, stops or targets, and price may ignore any of them.
Trading involves risk. Past performance does not guarantee future results.
Summary
The indicator marks bullish imbalance zones in green and bearish zones in red, extending them to the right until price fills them. Zones dynamically shrink as price trades into them and disappear once fully filled. The shading intensity reflects the volume behind the move, using tick volume data from cTrader.
Session boxes for Asia (Tokyo), London, and New York are color-coded, with dotted lines marking session highs and lows until price touches these levels. ADR projections at 50%, 75%, and 100% of the average daily range help gauge how much of the day’s range price has covered. A compact panel displays current ADR values and the portion of the range used.
This indicator supports any market with candlestick charts, including stock indices, forex, gold, and cryptocurrencies. It works best on intraday charts up to 1-hour for session boxes and on intraday and daily charts for ADR projections. Tick, Renko, range, and Heikin Ashi charts are not supported. Alerts for imbalance events and fills are optionally available.