
Fair Value Gap Pro+
Indikator
Versi 1.0, Nov 2025
Windows, Mac
3.0
Ulasan: 2
Deskripsi
Fair Value Gap Pro – Deteksi FVG Kelas Institusional
📝 Deskripsi Produk
Buka Presisi Institusional dengan Fair Value Gap Pro
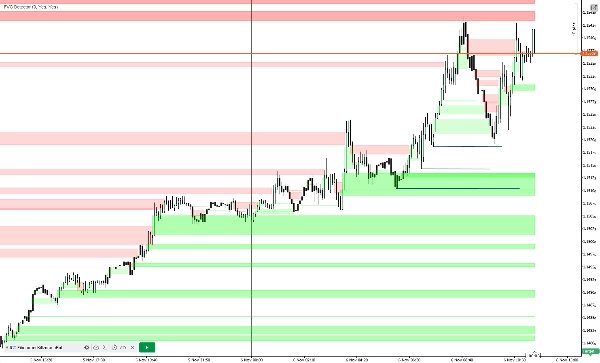
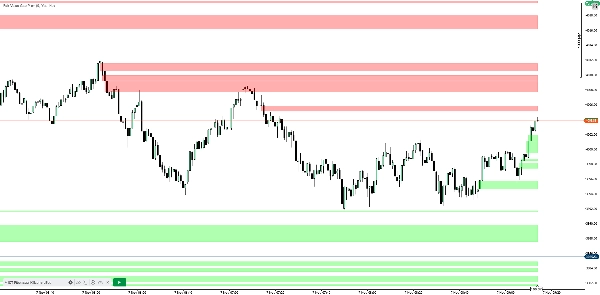
Fair Value Gap Pro adalah indikator overlay yang kuat dirancang untuk trader yang ingin mengidentifikasi dan memanfaatkan ketidakefisienan harga institusional dengan akurasi bedah. Dibuat untuk scalper, trader swing, dan ahli strategi algoritmik, alat ini secara otomatis mendeteksi Fair Value Gap (FVG) bullish dan bearish menggunakan logika 3-candle—tanpa basa-basi, hanya zona yang dapat ditindaklanjuti.
🔍 Fitur Utama:
- Deteksi otomatis FVG Bullish & Bearish menggunakan logika candle 1 dan candle 3
- Filter ukuran gap yang dapat disesuaikan (dalam pips) untuk menghilangkan noise
- Logika perpanjangan sampai terisi untuk pelacakan zona yang persisten
- Memudar atau menghapus gap yang terisi untuk grafik yang bersih
- Visualisasi overlay dengan persegi panjang semi-transparan
- Kustomisasi warna untuk zona bullish dan bearish
🧠 Keunggulan Strategis:
- Temukan zona pembalikan dengan probabilitas tinggi sebelum keramaian
- Selaraskan dengan model institusional seperti ICT dan Market Maker Theory
- Gunakan bersamaan dengan order blocks, liquidity voids, dan imbalance zones
📊 Kasus Penggunaan
- Scalping: Identifikasi mikro-imbalance untuk entri sniper
- Swing Trading: Lacak gap yang belum terisi antar sesi
- Pengembangan Algo: Integrasikan dengan bot untuk logika zona otomatis
- Backtesting: Validasi perilaku FVG pada data historis
⚙️ Parameter
- Warna Gap Bullish: Menentukan warna yang digunakan untuk menyoroti Fair Value Gap bullish pada grafik.
- Warna Gap Bearish: Menentukan warna yang digunakan untuk menyoroti Fair Value Gap bearish.
- Gap Minimum (pips): Menyaring gap yang lebih kecil dari ambang pip yang ditentukan untuk mengurangi noise.
- Perpanjang Sampai Terisi: Mempertahankan zona gap diperpanjang ke depan waktu sampai harga mengisinya.
- Tampilkan Gap Terisi: Memungkinkan Anda untuk memudar atau menghapus zona sepenuhnya setelah terisi.
🎯 Target Audiens
- Trader yang menggunakan ICT, SMC, atau model institusional
- Pengembang yang membangun bot berbasis konfluensi
- Analis yang mencari kejelasan visual pada ketidakefisienan harga
📦 Ide Bonus untuk Daftar Toko
- Tambahkan tangkapan layar yang menunjukkan gap bullish dan bearish dalam aksi
- Sertakan demo video singkat dengan walkthrough grafik langsung
- Tawarkan versi percobaan gratis atau terbatas untuk meningkatkan konversi
Ringkasan
Ringkasan AI
Fair Value Gap Pro+ is an overlay indicator designed to identify and visualize institutional price inefficiencies known as Fair Value Gaps (FVGs) on trading charts. It automatically detects bullish and bearish FVGs using a three-candle logic, highlighting these zones with customizable semi-transparent rectangles. The indicator includes features such as adjustable minimum gap size filters to reduce noise, extend-until-filled logic to track persistent zones, and options to fade or remove filled gaps for clearer chart analysis. Users can customize colors for bullish and bearish gaps to suit their preferences.
This tool supports various trading styles including scalping, swing trading, algorithmic strategy development, and backtesting. It aligns with institutional trading models like ICT and Market Maker Theory and can be used in conjunction with order blocks, liquidity voids, and imbalance zones to identify high-probability reversal areas. Fair Value Gap Pro+ is applicable across multiple markets including Forex, indices, commodities, cryptocurrencies, and stocks. It is suitable for traders, analysts, and developers seeking precise detection of market imbalances and enhanced visual clarity on price inefficiencies.
This tool supports various trading styles including scalping, swing trading, algorithmic strategy development, and backtesting. It aligns with institutional trading models like ICT and Market Maker Theory and can be used in conjunction with order blocks, liquidity voids, and imbalance zones to identify high-probability reversal areas. Fair Value Gap Pro+ is applicable across multiple markets including Forex, indices, commodities, cryptocurrencies, and stocks. It is suitable for traders, analysts, and developers seeking precise detection of market imbalances and enhanced visual clarity on price inefficiencies.
Profil indikator
Ulasan pelanggan
3.0
Ulasan: 2
5 | 50 % | |
4 | 0 % | |
3 | 0 % | |
2 | 0 % | |
1 | 50 % |
Ulasan pelanggan
November 9, 2025
Absolutely no multi-timeframe support despite this line in the description: ✅ Multi-Timeframe Support Display higher timeframe FVGs (e.g., H1, H4, D1) directly on lower charts like M5 or M15 for confluence.
November 9, 2025
Fair Value Gap Pro+ is a top-tier ICT tool - precise FVG detection, clean visuals, and real-time updates. Perfect for mapping imbalance zones and timing entries. A dream for Smart Money traders; adding alerts would make it flawless.
Diskusi
Pertanyaan umum
Signal
Indices
Commodities
GBPUSD
RSI
Bollinger
Fibonacci
Scalping
AI
XAUUSD
NAS100
MACD
BTCUSD
Forex
Breakout
EURUSD
Martingale
Prop
ZigZag
Supertrend
Fair Value Gap
SMC
Crypto
Grid
Stocks
ATR
USDJPY
VWAP
Produk-produk yang tersedia melalui cTrader Store, termasuk bot trading, indikator, dan plugin, disediakan oleh pengembang pihak ketiga serta hanya ditujukan untuk akses teknis dan informasi. cTrader Store bukan broker dan tidak menyediakan saran investasi, rekomendasi pribadi, atau jaminan apa pun tentang kinerja di masa mendatang.


Harga
Sejak 22/11/2024
135
Penjualan
2.6K
Instal gratis