
Описание
⚡ Ключевые особенности
- Динамическое обнаружение зон
-
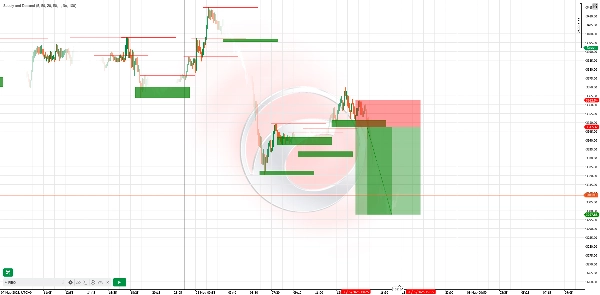
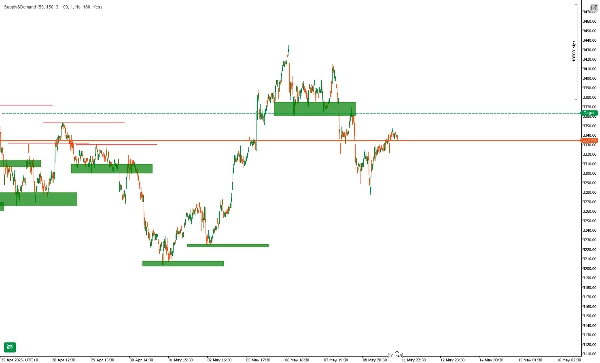
- Автоматически определяет максимумы/минимумы колебаний и в реальном времени рисует зоны предложения (сопротивления) и спроса (поддержки).
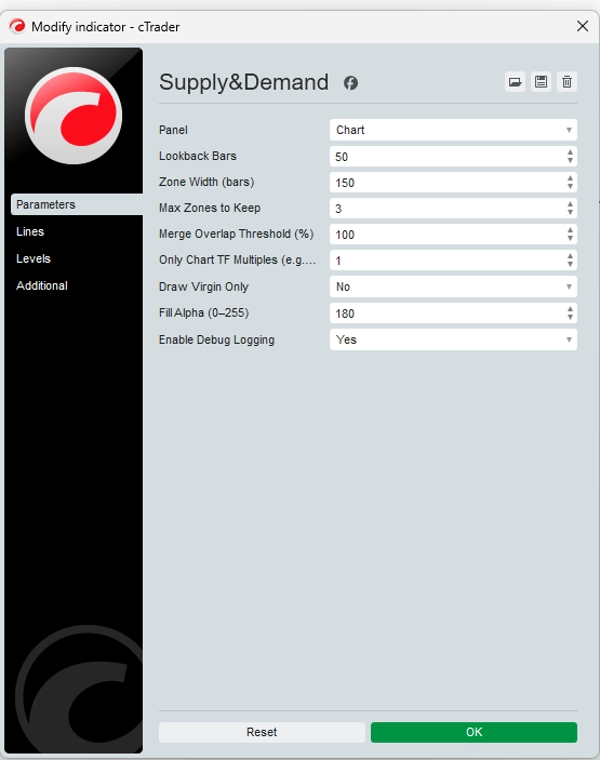
- Настраиваемые параметры обратного просмотра и ширины зоны позволяют адаптировать чувствительность под любой рынок или таймфрейм.
- Выделение девственных зон
-
- Свежие «девственные» зоны (никогда не затронутые ценой) визуально выделены — торгуйте там, где институциональные игроки оставили ордера.
- По желанию можно скрыть затронутые зоны, чтобы не загромождать график.
- Фильтрация по нескольким таймфреймам
-
- Отображаются только зоны, соответствующие кратному таймфрейму вашего графика (например, показывать дневные зоны на часовом графике).
- Быстро видьте совпадение зон предложения/спроса с более высоким таймфреймом с вашей внутридневной настройкой.
- Без перерисовки и задержек
-
- Зоны фиксируются после построения — линии не исчезают и не смещаются после движения цены.
- Проверенная надежность: зоны остаются статичными, что дает уверенность в историческом анализе.
- Пользовательские оповещения и журналирование
-
- Получайте всплывающие или email-уведомления, когда цена входит в зону или пробивает её.
- Подробный журнал отладки показывает создание зон, пропущенные перекрытия и касания зон.
🚀 Как это работает
- Обнаружение пивотов: Индикатор сканирует каждый новый бар на предмет пивотных максимумов (предложение) и минимумов (спрос) на основе выбранного обратного просмотра.
- Построение зон: Для каждого пивота рисуется прямоугольная зона, простирающаяся вперед — выделяя места, где, вероятно, институциональные игроки разместили лимитные ордера.
- Фильтрация перекрытий: Зоны, перекрывающиеся сверх вашего порога, объединяются или пропускаются, чтобы оставались только самые значимые области.
- Опция только для девственных зон: Оставляйте видимыми только нетронутые зоны, чтобы сосредоточиться на самых свежих институциональных уровнях.
🎯 Примеры торговых стратегий
СтратегияТаймфреймВходСтоп‑лоссТейк‑профит
Отторжение зоны
H1
Ждите, пока цена поднимется в зону спроса и покажет медвежью свечу (поглощение/пин-бар) в зоне предложения
Незначительно за пределами границы зоны
1.5× высоты зоны
Совпадение таймфреймов
M15 + H4
Определите зону спроса H4, затем переключитесь на M15 для поиска бычьей свечи с импульсом внутри этой зоны
Ниже минимума зоны H4
Следующий максимум колебания H4
Прорыв и повторное тестирование
H4
После прорыва зоны предложения ждите повторного теста нижней границы зоны и медвежьего подтверждения
Выше верхней границы зоны
Последний минимум H4
Совет по использованию: Используйте вместе с дивергенцией RSI или MACD внутри зон для сигналов с более высокой вероятностью.
📈 Пример из реальной торговли
- На EURUSD H4 индикатор рисует зону спроса на уровне 1.0950–1.0980.
- Цена опускается в зону, формируя бычью свечу поглощения на M15.
- Вход на 1.0970, стоп на 1.0945 (ниже зоны), цель на 1.1040 (следующее сопротивление H4).
- Результат: +70 пипсов (~6.4× риск).
⚠️ Отказ от ответственности
Этот индикатор — инструмент, а не гарантированная система прибыли. Прошлые результаты не гарантируют будущих. Всегда используйте правильное управление рисками (например, максимум 2% на сделку), сначала тестируйте на демо-счете и сочетайте с собственным анализом. Торговля связана с риском потерь; торгуйте только тем капиталом, который можете позволить себе потерять.
Сводка
It supports multi-timeframe filtering, allowing users to display zones aligned with higher timeframe multiples on lower timeframe charts, facilitating confluence analysis. Zones are non-repainting and non-lagging; once drawn, they remain fixed, ensuring reliable historical analysis. Custom alerts notify users when price enters or breaks these zones, and detailed logs track zone creation and interactions.
The indicator operates by scanning each new bar for pivot highs and lows, constructing rectangular zones extending forward, and filtering overlapping zones to retain the most significant areas. It offers a “virgin-only” mode to focus on fresh institutional levels.
Example strategies include zone rejection, multi-timeframe confluence, and break & retest setups, often combined with RSI or MACD divergence for higher-probability signals. A real-world example on EURUSD H4 demonstrates entry, stop-loss, and take-profit placement based on demand zones and candlestick confirmation.
Отзывы покупателей
5 | 75 % | |
4 | 25 % | |
3 | 0 % | |
2 | 0 % | |
1 | 0 % |


