
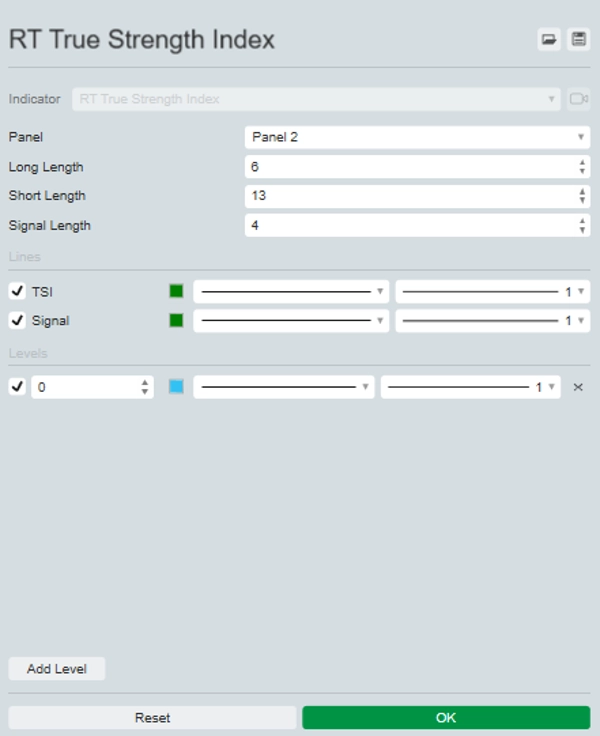
Apresentando o indicador True Strength Index (TSI), uma ferramenta poderosa projetada para aprimorar sua estratégia de negociação, fornecendo insights claros sobre o momentum do mercado e a força da tendência.
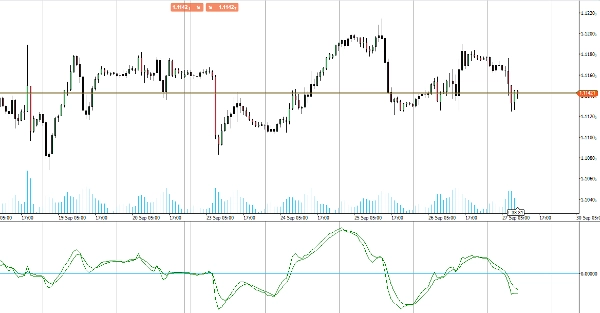
O indicador TSI mede a força subjacente dos movimentos de preço, suavizando o ruído do mercado para lhe dar uma imagem mais precisa da direção da tendência. Ao destacar condições de sobrecompra e sobrevenda, o TSI ajuda você a identificar pontos potenciais de reversão e confirmar continuações de tendência.
O TSI usa médias móveis do momentum subjacente de um instrumento financeiro. O momentum é considerado um indicador líder dos movimentos de preço, e uma média móvel caracteriza-se por ficar atrás do preço. O TSI combina essas características para criar uma indicação de preço e direção mais sincronizada com as viradas do mercado do que o momentum ou a média móvel isoladamente.
Perfeito para traders que buscam refinar sua análise e melhorar a tomada de decisões, o indicador TSI oferece uma forma confiável e intuitiva de avaliar a dinâmica do mercado. Atualize seu kit de ferramentas de negociação com o True Strength Index para um desempenho superior nas negociações.


