

HIGHS LOWS AEGIS
Indicador
1 compras
Versão 1.0, Dec 2025
Windows, Mac
4.6
Avaliações: 3
Desde 14/04/2025
1
Vendas
Descrição
Indicador simples que mostra as Máximas e Mínimas escolhidas.
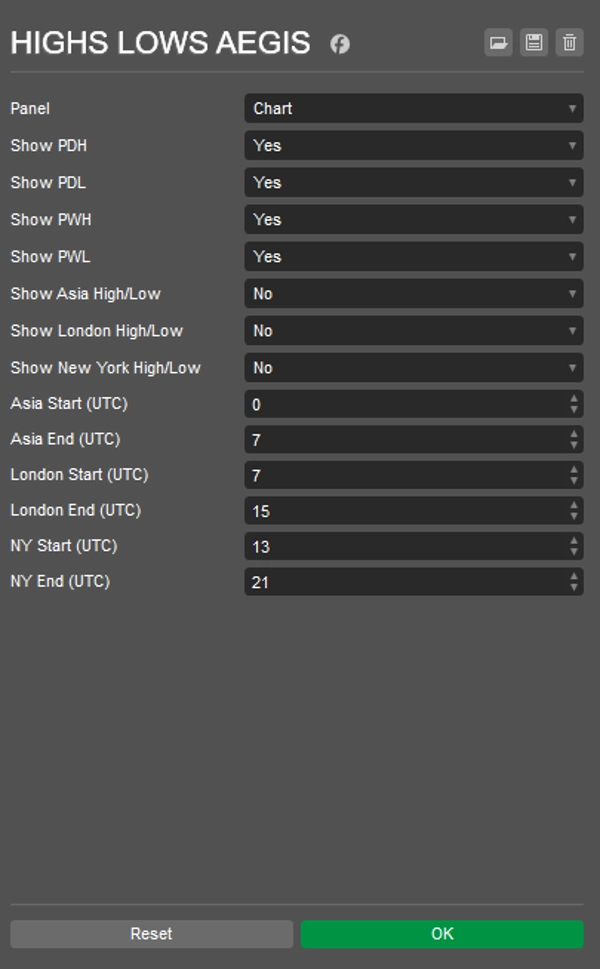
- Mínima/Máxima do Dia Anterior
- Mínima/Máxima da Semana Anterior
- Mínima/Máxima das sessões Ásia/Londres/Nova York
- Hora UTC personalizável para início/fim de cada sessão
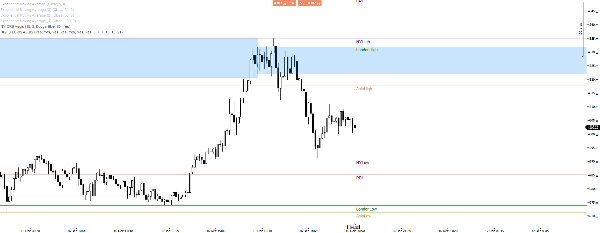
Linhas rotuladas para melhor visualização do que é o quê.
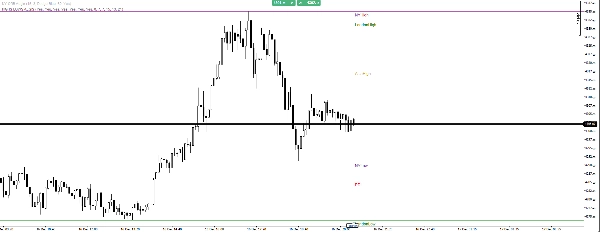
Bom uso com quase qualquer estratégia, eu uso com ORB, que ajuda muito a evitar falsos rompimentos, como na imagem de hoje com XAUUSD.
Resumo
AI summary
HIGHS LOWS AEGIS is a trading indicator that displays selected high and low price levels on a chart. It shows Previous Day Low/High, Previous Week Low/High, and session-specific lows and highs for Asia, London, and New York trading sessions. Users can customize the UTC start and end times for each session. The indicator features labeled lines to clearly identify each level. It is designed to be compatible with various trading strategies, including opening range breakout (ORB), and can assist in identifying potential breakout points and avoiding false breakouts. The indicator supports multiple markets such as Forex, commodities, indices, and stocks, and is applicable to symbols including EURUSD, XAUUSD (gold), and NAS100 (Nasdaq 100).
Perfil do indicador
Avaliações de clientes
4.6
Avaliações: 3
5 | 67 % | |
4 | 33 % | |
3 | 0 % | |
2 | 0 % | |
1 | 0 % |
Avaliações de clientes
December 27, 2025
December 24, 2025
weak ideas are easier to skip, but it should stay in the support stack.
December 21, 2025
Conversa
Perguntas frequentes
Prop
Forex
Breakout
Scalping
Indices
EURUSD
Commodities
SMC
Stocks
XAUUSD
NAS100
Os produtos disponíveis através da cTrader Store, incluindo bots de negociação, indicadores e plugins, são fornecidos por programadores terceiros e são disponibilizados apenas para fins informativos e de acesso técnico. A cTrader Store não é um corretor e não fornece aconselhamento em matéria de investimento, recomendações pessoais ou qualquer garantia de desempenho no futuro.

















Preço
Desde 14/04/2025
1
Vendas