Descrição
Signal Strike é um indicador de negociação profissional projetado para ctrader que oferece sinais claros de entrada com alta confiança diretamente no seu gráfico. Construído com lógica avançada que combina tendência, momentum, volatilidade e confirmação de volume, esta ferramenta ajuda os traders a identificar oportunidades precisas de COMPRA e VENDA com confiança.
Ao contrário dos indicadores genéricos, o Signal Strike é projetado para filtrar candles de indecisão e configurações fracas. Quando as condições se alinham, o indicador traça níveis de entrada, stop loss e take profit diretamente no gráfico, junto com uma porcentagem de confiança. Se nenhuma configuração válida for detectada, o indicador exibirá “Nenhum sinal válido de COMPRA/VENDA” no topo do gráfico — para que você sempre saiba exatamente quando agir e quando ficar de fora.
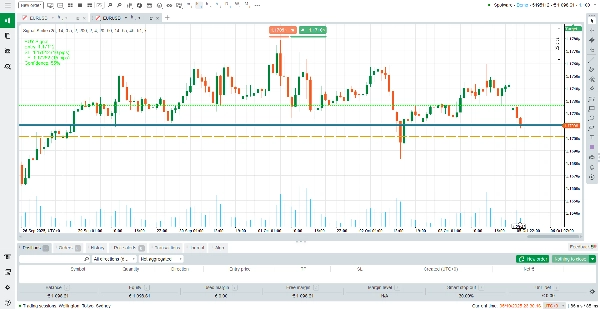
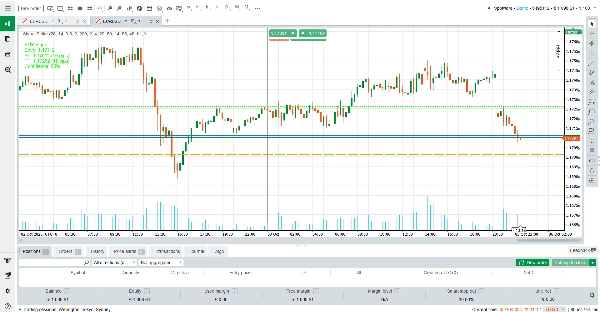
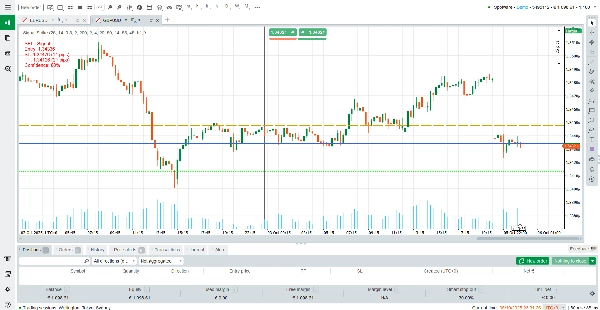
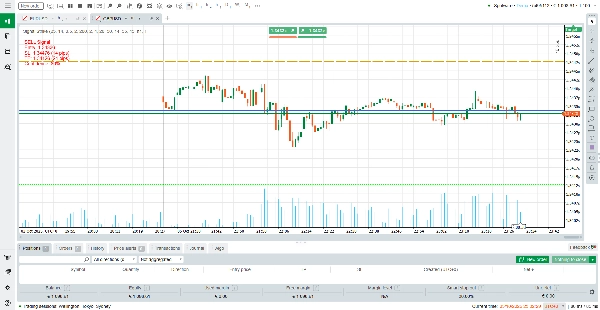
No Signal Strike, cada cor de linha tem um significado claro para ajudar os traders a lerem o gráfico instantaneamente. A Linha de Entrada é desenhada em azul, marcando o preço exato onde a configuração de negociação é acionada. A Linha de Stop Loss aparece em laranja, mostrando o nível de proteção onde a negociação será fechada se o mercado se mover contra você.
A Linha de Take Profit é exibida em verde-limão, destacando o nível alvo onde os lucros são garantidos. Para clareza direcional, sinais de COMPRA são enfatizados em verde, enquanto sinais de VENDA são destacados em vermelho. Essas cores fortes e saturadas garantem que cada elemento se destaque, facilitando a distinção entre zonas de entrada, risco e recompensa num relance.
Como Ler os Sinais
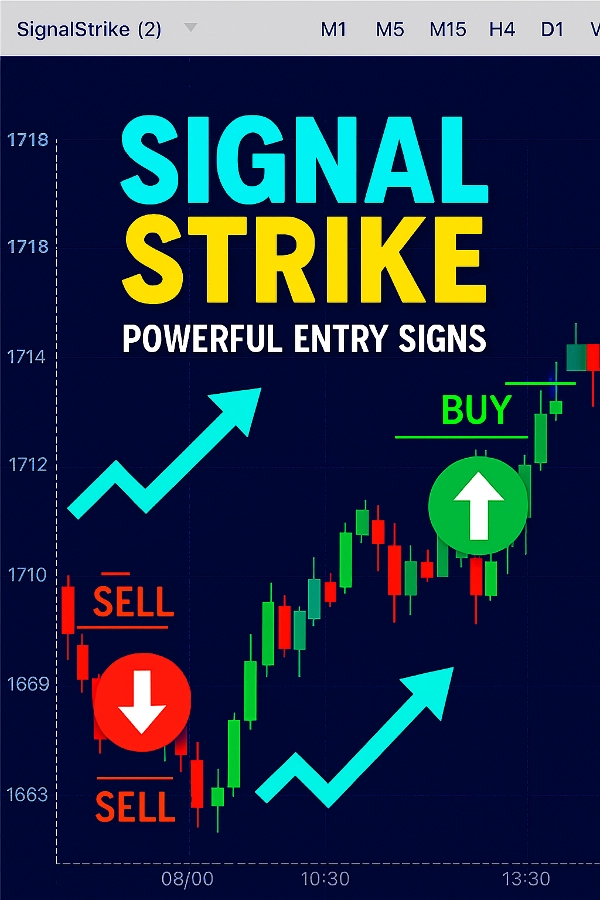
Sinal de COMPRA: Uma seta verde para cima e um rótulo aparecem, mostrando o preço de entrada, stop loss, take profit e nível de confiança.
Sinal de VENDA: Uma seta vermelha para baixo e um rótulo aparecem com os mesmos detalhes.
Sem Sinal: Se as condições do mercado não forem fortes o suficiente, o indicador escreve “Nenhum sinal válido de COMPRA/VENDA” no topo do gráfico.
TP/SL Dinâmicos: Os níveis de take profit e stop loss são ajustados automaticamente com base na volatilidade e nas condições do RSI.
Para maximizar os resultados, recomenda-se alternar entre os períodos de tempo (M1, M5, M15, H1, H4) para encontrar os sinais mais claros para seu estilo de negociação.
Como o Indicador Funciona
Signal Strike combina múltiplas camadas de análise:
Detecção de Tendência.
Filtro de Momentum.
Verificação de Volatilidade.
Confirmação de Volume.
Filtro de Indecisão – Candles pequenos e fracos são ignorados para evitar entradas falsas.
Só quando essas condições se alinham o indicador gera um sinal de COMPRA ou VENDA. Isso garante que cada sinal seja respaldado por múltiplas confirmações, reduzindo ruídos e melhorando a precisão.
Principais Características (5 Destaques)
Níveis Claros de Entrada, SL e TP – Visíveis instantaneamente no gráfico.
Porcentagem de Confiança – Saiba a força de cada sinal antes de entrar.
Suporte Multi-Período – Funciona em todos os períodos de M1 a H4.
Filtragem Automática – Evita sinais falsos durante períodos de indecisão ou baixo volume.
Rótulos Amigáveis – Fáceis de ler, com “Sem Sinal” exibido quando as condições não são atendidas.
Configurações Recomendadas por Período
O indicador inclui entradas flexíveis (LookbackCandles, ATRPeriod, ATRMultiplier, períodos SMA, níveis RSI, etc.). Abaixo estão as configurações otimizadas para diferentes estilos de negociação:
M1 (Scalping)
LookbackCandles: 20
ATRPeriod: 10
ATRMultiplier: 0.4
SMA Rápido/Lento: 10 / 30
RSI: 12 (Compra > 55, Venda < 45) → Melhor para scalps ultra-curtos com entradas rápidas.
M5 (Intraday Rápido)
LookbackCandles: 25
ATRPeriod: 14
ATRMultiplier: 0.5
SMA Rápido/Lento: 20 / 50
RSI: 14 (Compra > 55, Venda < 45) → Equilibrado para trades intraday curtos.
M15 (Swing Intraday)
LookbackCandles: 30
ATRPeriod: 14
ATRMultiplier: 0.6
SMA Rápido/Lento: 20 / 60
RSI: 14 (Compra > 56, Venda < 44) → Ideal para capturar movimentos médios intraday.
H1 (Swing Trading)
LookbackCandles: 40
ATRPeriod: 20
ATRMultiplier: 0.7
SMA Rápido/Lento: 30 / 80
RSI: 14 (Compra > 57, Venda < 43) → Filtros mais fortes para swings em períodos maiores.
H4 (Position Trading)
LookbackCandles: 50
ATRPeriod: 20
ATRMultiplier: 0.8
SMA Rápido/Lento: 50 / 100
RSI: 14 (Compra > 58, Venda < 42) → Melhor para entradas de longo prazo com alta confiança.
Por que Escolher o Signal Strike?
Signal Strike não é apenas mais um indicador — é uma ferramenta de tomada de decisão que economiza tempo, reduz incertezas e ajuda os traders a focar nas melhores oportunidades. Seja você um scalper no M1 ou um swing trader no H4, o Signal Strike se adapta ao seu estilo e fornece sinais de entrada poderosos com clareza e precisão.
Assuma o controle da sua negociação com o Signal Strike e experimente a diferença de negociar com confiança.
Resumo
When a valid trade setup occurs, Signal Strike plots entry, stop loss, and take profit levels on the chart, each color-coded for clarity: blue for entry, orange for stop loss, and lime green for take profit. BUY signals are marked with green arrows and labels, while SELL signals use red. A confidence percentage accompanies each signal to indicate its strength. If no valid setup is detected, a “No valid BUY/SELL signal” message appears.
The indicator supports multiple timeframes from M1 to H4, with recommended settings optimized for scalping, intraday, swing, and position trading styles. Take profit and stop loss levels adjust dynamically based on volatility and RSI conditions. Signal Strike aims to assist traders in making informed decisions by highlighting clear entry points, risk levels, and profit targets across various markets including Forex, commodities, crypto, and stocks.
Avaliações de clientes
5 | 50 % | |
4 | 0 % | |
3 | 50 % | |
2 | 0 % | |
1 | 0 % |