
Descrição
Ultimate Trend ADX é uma versão poderosa e refinada do clássico Índice Direcional Médio (ADX), projetada para oferecer aos traders uma visão mais clara e dinâmica das tendências e do momentum do mercado. Ao contrário do ADX padrão, esta ferramenta aprimorada aplica técnicas avançadas de suavização (EMA ou KAMA) e introduz opções de escala para tornar as linhas do indicador mais responsivas e visualmente impactantes. O resultado é um indicador de nível profissional que ajuda você a identificar tendências fortes, detectar reversões e confirmar entradas com maior confiança.
Como Ler o Indicador
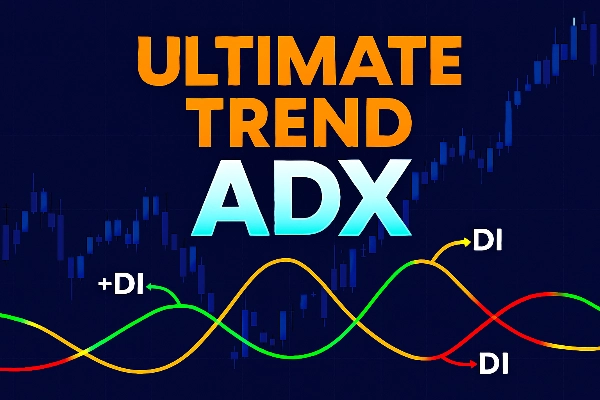
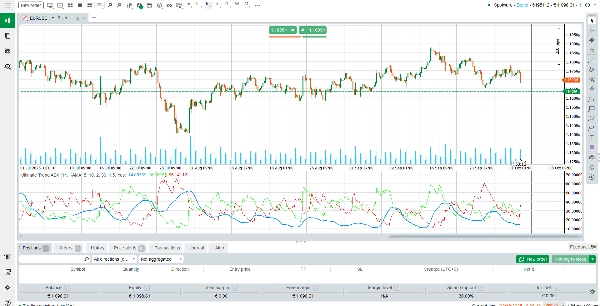
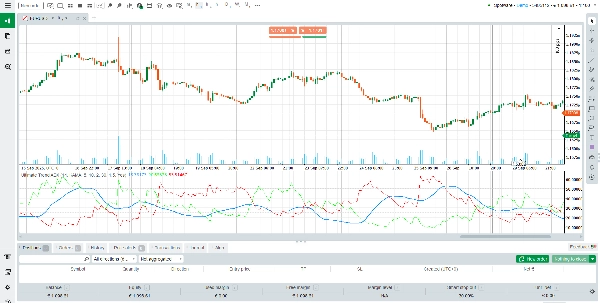
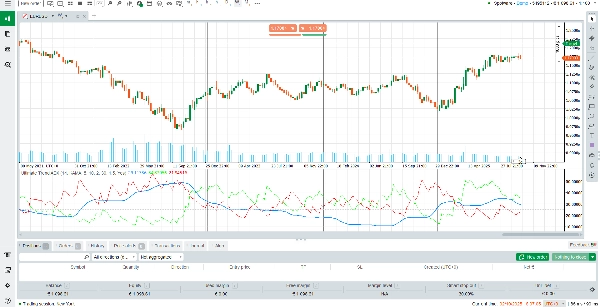
Ultimate Trend ADX exibe três linhas principais em uma janela separada abaixo do seu gráfico:
Linha ADX (Azul/Amarelo): Mede a força geral da tendência. Um ADX em alta indica uma tendência fortalecida, enquanto um ADX em queda sugere enfraquecimento do momentum. Valores acima de 25 normalmente sinalizam uma tendência forte.
Linha +DI (Verde): Representa o movimento direcional de alta. Quando +DI está acima de –DI, os compradores estão no controle.
Linha –DI (Vermelho): Representa o movimento direcional de baixa. Quando –DI está acima de +DI, os vendedores dominam o mercado.
Ler os sinais é simples:
Quando +DI cruza acima de –DI e o ADX está subindo, isso sugere uma forte tendência de alta.
Quando –DI cruza acima de +DI e o ADX está subindo, isso sinaliza uma forte tendência de baixa.
Quando o ADX está abaixo de 20–25, o mercado geralmente está em consolidação ou sem direção clara.
O indicador também inclui níveis horizontais em 0, 25, 50, 75 e 100 para ajudar você a avaliar rapidamente a intensidade da tendência.
Como o Indicador Funciona
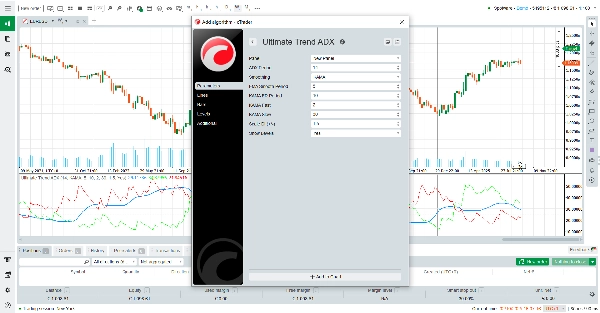
O Ultimate Trend ADX é baseado no Sistema de Movimento Direcional padrão, mas aprimorado com algoritmos modernos de suavização:
Média Móvel Exponencial (EMA): Oferece uma opção de suavização rápida e responsiva para traders que desejam capturar o momentum de curto prazo.
Média Móvel Adaptativa de Kaufman (KAMA): Ajusta-se dinamicamente à volatilidade do mercado, filtrando ruídos durante condições laterais enquanto permanece sensível durante tendências fortes.
Fator de Escala para +DI e –DI: Amplifica as linhas verde e vermelha, tornando os sinais de alta e baixa mais visíveis e fáceis de interpretar no gráfico.
Essa combinação garante que o indicador se adapte a diferentes ambientes de mercado, oferecendo clareza e precisão.
Principais Características
Cálculo ADX Aprimorado – Usa suavização EMA ou KAMA para uma medição mais precisa e adaptativa da força da tendência.
Sinais Visuais Claros – Codificação de cores distinta (azul/amarelo para ADX, verde para +DI, vermelho para –DI) torna a interpretação intuitiva.
Sensibilidade Ajustável – Parâmetros permitem ajustar a responsividade para combinar com seu estilo de negociação.
Níveis Horizontais Integrados – Níveis de referência rápidos (0/25/50/75/100) ajudam você a avaliar instantaneamente a intensidade da tendência.
Por Que Escolher o Ultimate Trend ADX?
O sucesso na negociação muitas vezes depende de identificar quando um mercado está em tendência e quando não está. O Ultimate Trend ADX oferece essa vantagem ao combinar a confiabilidade do ADX clássico com aprimoramentos modernos que o tornam mais afiado, claro e acionável. Seja você trader de forex, ações, índices ou commodities, este indicador ajudará a filtrar ruídos, confirmar sinais e manter-se alinhado com a direção predominante do mercado.
Resumo
This indicator incorporates exponential moving average (EMA) or Kaufman’s adaptive moving average (KAMA) smoothing techniques to improve responsiveness and reduce noise. It also features a scaling factor for the +DI and –DI lines, enhancing signal visibility. Horizontal reference levels at 0, 25, 50, 75, and 100 assist in quickly assessing trend intensity.
Ultimate Trend ADX supports multiple markets including forex, stocks, indices, commodities, and cryptocurrencies. It is suitable for various trading strategies such as scalping, breakout, and grid trading. Adjustable sensitivity settings allow customization to fit different trading styles. This tool aids traders in identifying strong trends, spotting reversals, and confirming entry signals with improved clarity and precision.
Avaliações de clientes
5 | 100 % | |
4 | 0 % | |
3 | 0 % | |
2 | 0 % | |
1 | 0 % |


