

Descrição
O Índice de Pressão de Liquidez é uma ferramenta profissional projetada para oferecer aos traders uma visão mais profunda das dinâmicas ocultas da liquidez do mercado. Ao contrário dos osciladores tradicionais que reagem apenas ao preço, o Índice de Pressão de Liquidez combina volume de ticks, compressão de volatilidade e fluxo direcional em uma única linha fácil de ler. Isso o torna um companheiro poderoso para traders que desejam entender se a pressão de compra ou venda está realmente dominando por trás das velas.
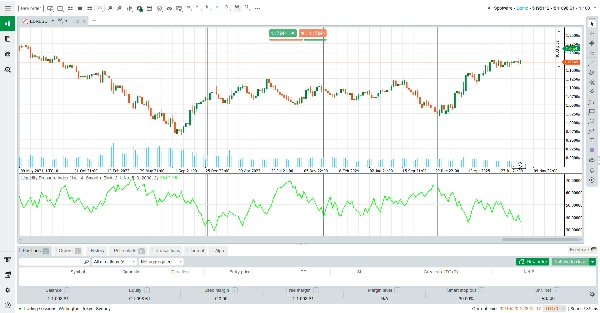
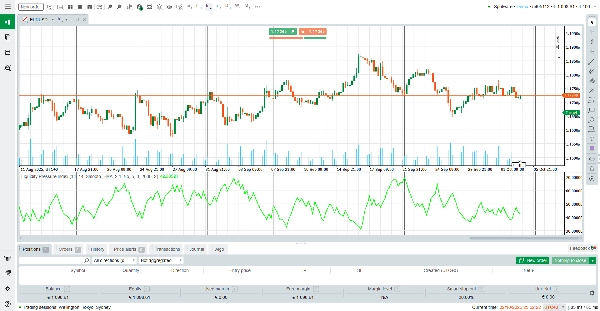
Em sua essência, o ALB calcula o equilíbrio entre a liquidez acumulada de compra e a liquidez acumulada de venda, normalizando o resultado em relação ao volume de ticks móvel. O resultado é centrado em torno do nível neutro de 50. Valores acima de 50 indicam liquidez de compra mais forte, enquanto valores abaixo de 50 destacam liquidez de venda mais forte.
Esse simples indicativo visual permite que os traders avaliem instantaneamente o fluxo subjacente de ordens sem precisar interpretar múltiplos indicadores ao mesmo tempo.
Como Ler o Indicador
Linha acima de 50: O mercado mostra liquidez do lado comprador mais forte. Isso frequentemente apoia a continuação de alta ou sinaliza demanda oculta absorvendo ordens de venda.
Linha abaixo de 50 : O mercado mostra liquidez do lado vendedor mais forte. Isso frequentemente apoia a continuação de baixa ou sinaliza oferta oculta absorvendo ordens de compra.
Linha estável ou próxima de 50: A liquidez está equilibrada, sugerindo indecisão ou consolidação.
Opções de suavização: Os traders podem escolher entre suavização EMA ou KAMA para reduzir o ruído e focar na tendência dominante da liquidez.
Como Funciona
O indicador primeiro mede a volatilidade do intervalo verdadeiro (ATR) e a compara com o intervalo real da vela para estimar a compressão. Em seguida, combina isso com o volume de ticks para separar a liquidez pendente (ordens aguardando no livro) da liquidez executada (ordens já preenchidas). Dependendo da direção da vela, o algoritmo aloca absorção oculta de compra ou venda. Finalmente, o resultado é normalizado em relação a uma EMA móvel do volume de ticks, escalado e suavizado para maior clareza.
O resultado é um índice dinâmico de liquidez que se adapta às condições do mercado e revela a disputa entre compradores e vendedores em tempo real.
Principais Características
Insight Focado em Liquidez: Vai além do preço para revelar pressão oculta de compra/venda.
Suavização Adaptativa: Escolha entre EMA ou KAMA para redução de ruído.
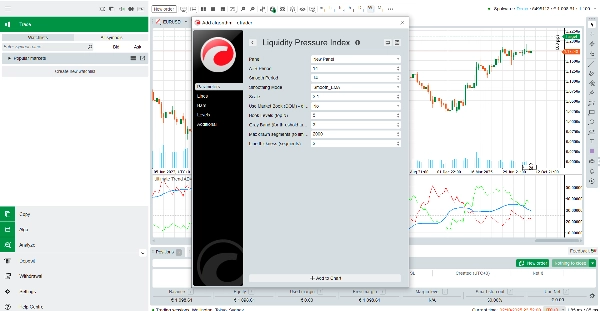
Parâmetros Personalizáveis: Controle o período do ATR, comprimento da suavização, escala e espessura da linha.
Desempenho Otimizado: Design leve com limites de segmento para garantir gráficos suaves.
Por Que Usar o Índice de Pressão de Liquidez?
Em mercados de alta velocidade, o preço sozinho pode ser enganoso. O Advanced Liquidity Balance equipa os traders com uma perspectiva mais profunda, mostrando se o mercado é realmente sustentado pela liquidez ou se os movimentos estão ocorrendo com participação fraca. Seja você um scalper buscando desequilíbrios de curto prazo ou um swing trader confirmando a força da tendência, o Índice de Pressão de Liquidez oferece uma lente profissional de liquidez—e o melhor de tudo, é completamente gratuito.
Baixe hoje e adicione uma nova dimensão de clareza às suas decisões de negociação.
Resumo
Avaliações de clientes
5 | 0 % | |
4 | 100 % | |
3 | 0 % | |
2 | 0 % | |
1 | 0 % |


