
LT_Ind_TradeNet
Gösterge
1 satın almalar
Sürüm 1.0, Oct 2025
Windows, Mac
5.0
Değerlendirmeler: 1
Açıklama
Not: Sadece cTrader Windows üzerinde test edilmiştir.
LT_Ind_TradeNet, tek bir işlem sembolü için odaklanmış bir kar takibi göstergesidir.
Tüccarların disiplinli kalmasına yardımcı olur; günün, haftanın ve ayın ne kadar kazandıklarını — net işlem durumlarına ayrılmış şekilde — gösterir.
Durumlar
- NoTrade – açık pozisyon yok
- Fresh – günün hedefi doğrultusunda yeni işlemler
- Manage – mevcut veya üst üste binen işlemlerin yönetimi
- Leftover – hedef veya oturum sonu sonrası kalan işlemler
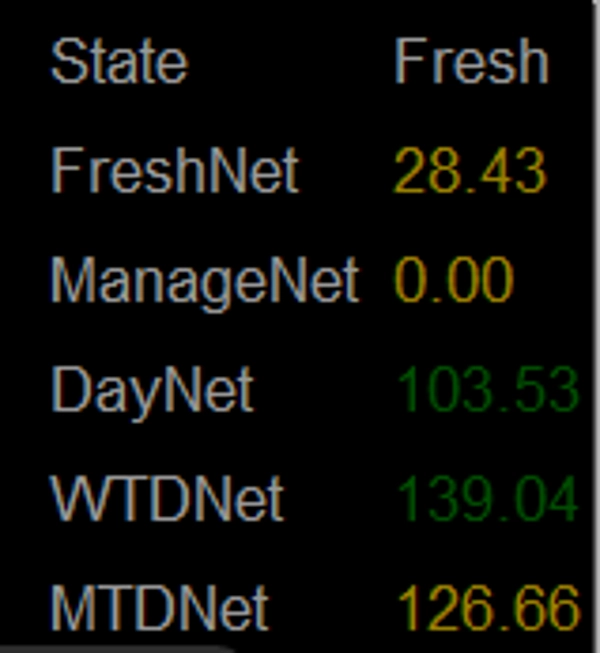
Gösterilen Metrikler
- FreshNet – tek taraflı işlemlerden net kar
- ManageNet – tüm üst üste binen işlemlerden net kar (her iki taraf)
- DayNet – mevcut günün toplam karı
- WTDNet – haftadan bugüne kar
- MTDNet – aydan bugüne kar
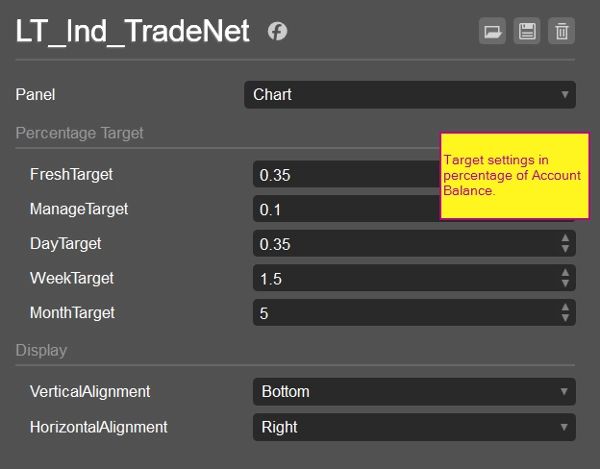
Amaç
- Tüccarların gerçekçi günlük veya haftalık hedeflere odaklanmasını sağlar
- Belirgin bir “yeterli” noktası tanımlayarak duygusal ve açgözlü davranışı azaltır
- İşlem yapmaya devam edip etmeyeceğine karar vermek için basit geri bildirim sağlar
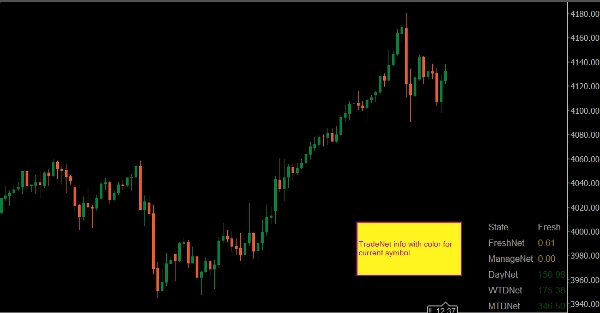
Öne Çıkanlar
- Sembol-özgü: her grafik kendi performansını gösterir
- Hafif ve müdahaleci olmayan
- Yapılandırılmış günlük/haftalık kar hedeflerini takip eden canlı tüccarlar için ideal
Temel İlke:
Kazanmada anahtar nokta yeterli olmaktır.
Özet
Gösterge profili
Müşteri değerlendirmeleri
5.0
Değerlendirmeler: 1
5 | 100 % | |
4 | 0 % | |
3 | 0 % | |
2 | 0 % | |
1 | 0 % |
Tartışma
SSS
Prop
Forex
Indices
Commodities
Crypto
Stocks
cTrader Store üzerinden erişilebilen işlem botları, göstergeler ve eklentiler gibi ürünler, üçüncü taraf sağlayıcılar tarafından sağlanır ve yalnızca bilgilendirme ve teknik erişim amaçlarıyla sunulur. cTrader Store bir broker değildir ve yatırım tavsiyesi, kişisel öneriler vermez veya gelecekteki performansı garanti etmez.


Fiyat
Başlangıç 25/09/2024
34
Satışlar