Descrição
▁▂▃▄▅▆▇ █ 10.000+ traders (institucionais + varejo) █ ▇▆▅▄▃▂▁
- Escolha nossos principais indicadores no cTrader 🏆
- ✨ Precisão exclusiva para resultados superiores ✨
- 📈 Nossos algoritmos — com os visuais mais bem avaliados 🎯—
- foram implementados com sucesso em 2 fundos quantitativos
▁▂▃▄▅▆▇ █████████████████████████████ ▇▆▅▄▃▂▁
_______________________________________________
_______________________________________________
📌 Indicadores de Estrutura de Mercado
· ✅ AdvancedMarket Structure: Bos, Choch, SwinLevels, Order Blocks, Market Structure& Liquidity Finder
· 🔄 Análise Dinâmica da Estrutura de Mercado de Pontos de Virada
· 🧱 Order Block
· ⛓️ BOS & CHOCH
· 🧠 ICT Power of 3
· 🌀 Zonas de Polaridade de Mercado
______________________________________________________________-
Loja de cBots : 🧠 Gold & BTC BreakoutSession Pivots 🧠
_______________________________________________
🔚 Sistemas Inteligentes de Saída
· 📍 Algoritmo Inteligente de Trailing
_______________________________________________
📐 Indicadores ZigZag
· 🔍 Projeção de Liquidez de Preço ZigZag
· ➖ ZigZag
· 🎯 Rastreador de Extremos Zig-Zag
_______________________________________________
🧱 Indicadores de Suporte e Resistência
· 🟩 Linhas de Suporte e Resistência SmartTrend
· 🧱 Todos os Níveis de Suporte e Resistência
_______________________________________________
📊 Indicadores de Tendência e Canal
· 🔄 Canal de Tendência Automático
· 📊 Supertrend
· ⚡Analisador de Tendência Momentum
· 🧠 Canal de Tendência Adaptativo
· 💥 Sistema de Rompimento de Canal
· 🌈 Gradiente Dinâmico de Tendência
_______________________________________________
💧 Ferramentas de Volume e Liquidez
· 📉 Mapa de Liquidação de Alavancagem
· 🔍 Gap de Valor Justo Momentum
· 🕒 Sessões de Gap de Valor Justo
_______________________________________________
⚡ Indicadores de Momentum e RSI
· 🚀 Momentum de Alcance Dinâmico
· 🔎 Rastreador de Viés de Vela Multi-Nível
_______________________________________________
🔮 Ferramentas de Previsão e Projeção
· 📐 Previsão Baseada em Linreg & ATR
· 📏 Regressão Linear Fibonacci Multi-tempo
· 📈 Projetor de Fluxo de Mercado Alimentado por Volume
______________________________________________________________________________________________________
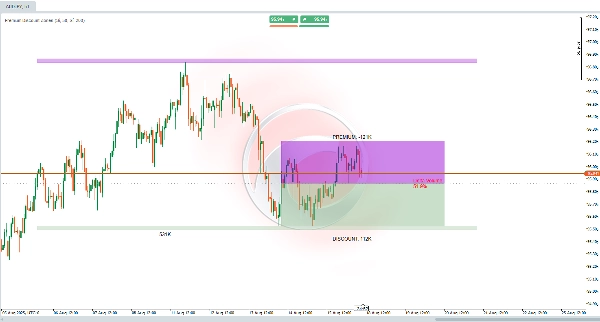
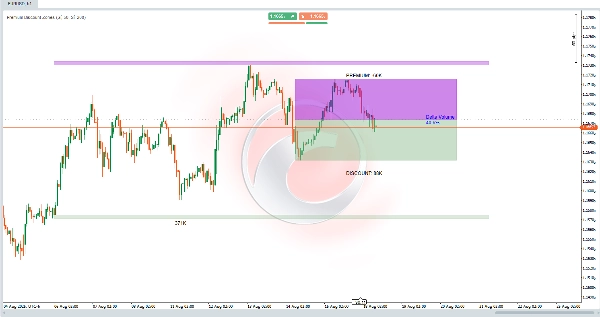
O Que o Indicador Premium Discount Zones Faz? 🎯
Este indicador é projetado para ajudá-lo a identificar áreas-chave com base nas máximas e mínimas recentes do mercado. Ele analisa um período configurável de barras passadas para determinar uma faixa geral de preço, calcula um equilíbrio do ponto médio, e divide essa faixa em duas zonas principais:
- 🔺 Premium (Zona Superior)
- 🟩 Desconto (Zona Inferior)
Também avalia o volume de negociação nessas barras para calcular um "Delta de Volume", que representa a porcentagem do volume associada a movimentos de baixa.
Para Que Serve? 💡
Este indicador ajuda você a identificar áreas onde o preço pode estar:
- 📈 Sobrevalorizado (Zona Premium) → Potencial para venda ou realização de lucros
- 📉 Subvalorizado (Zona de Desconto) → Potencial para compra ou acumulação
Ele fornece uma visão rápida dos desequilíbrios de mercado, destacando se o volume recente favorece movimentos de alta ou baixa. As zonas estruturais estendidas projetam níveis-chave além da faixa imediata, úteis para planejar negociações em tendências ou reversões. 🚀
Perfeito para estratégias que visam faixas de consolidação, rompimentos, negociação institucional ou análise de liquidez!
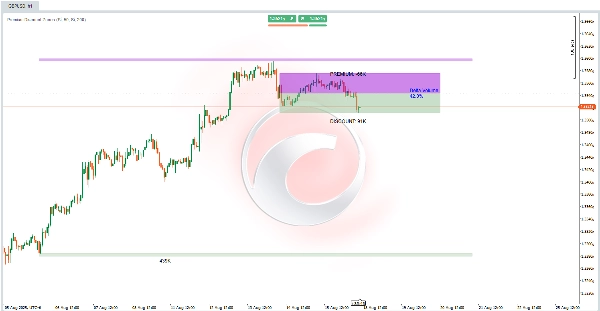
Como Interpretá-lo? 🔍
- 🟣 Zona Premium (Roxo, Acima do Equilíbrio) → Faixa superior, onde o preço é considerado "caro."
- 🟢 Zona de Desconto (Verde, Abaixo do Equilíbrio) → Faixa inferior, onde o preço é visto como "barato."
- ⚖️ Linha de Equilíbrio (Cinza, Meio) → Marca o ponto médio da faixa, atuando como um nível de equilíbrio. Um cruzamento de preço aqui pode sinalizar uma mudança de viés.
- 📊 Delta de Volume (Centro) → Mostra a % de volume baixista (🔴 >50% = baixista, 🔵 <50% = altista).
- 🏛 Zonas Estruturais (Extensões Sombreadas) → Áreas estendidas acima/abaixo dos extremos da faixa, atuando como suporte/resistência de longo prazo com uma margem baseada na ação recente do preço.
O indicador atualiza dinamicamente essas zonas nas barras recentes, estendendo-se para a direita para projeções futuras.
Como Usá-lo na Negociação? 🛠️
- Configuração Inicial:
-
- Ative níveis PD (principais) e zonas estruturais se desejar.
- Ajuste períodos de retrocesso:
-
- Curto (ex.: 50 barras) → Faixas recentes
- Longo (ex.: 200 barras) → Contexto estrutural
- Análise do Gráfico (ex.: Timeframe H1):
-
- Verifique se o preço está em 🟣 Premium (considere venda com confirmação baixista) ou 🟢 Desconto (considere compra com confirmação altista).
- Use Delta de Volume para confirmação:
-
- 🔴 >50% → Favorece vendas no Premium
- 🔵 <50% → Favorece compras no Desconto
- Estratégias de Entrada e Saída:
-
- 🟢 Comprar na Zona de Desconto: Se o preço entrar na zona verde & o delta estiver baixo, procure entradas longas com stops abaixo da mínima da zona e alvos no equilíbrio ou Premium.
- 🟣 Vender na Zona Premium: Se o preço alcançar a zona roxa & o delta estiver alto, considere vendas com stops acima da máxima da zona e alvos no equilíbrio ou Desconto.
- 🏛 Use Zonas Estruturais para negociações de longo prazo, aplicando a margem como margem de erro.
Resumo
The indicator also computes a Volume Delta, representing the percentage of volume associated with bearish movements, which helps confirm market bias: values above 50% favor bearish conditions, while values below 50% favor bullish conditions. Extended structural zones project key support and resistance levels beyond the immediate range, useful for planning trades in trending or reversal markets.
Users can adjust lookback periods to focus on recent ranges or broader structural context. The indicator dynamically updates these zones and extends them forward for future projections. It supports trading strategies involving consolidation ranges, breakouts, institutional trading, and liquidity analysis by providing visual cues on price valuation and volume-driven market imbalances.