present
Registrati e ricevi uno sconto da $50 sul tuo primo acquisto
Trading product for IR Multi Data Indicatore, image 1
IR Multi Data
5.0
Recensioni: 1
5.63K
Installazioni gratuite

Descrizione

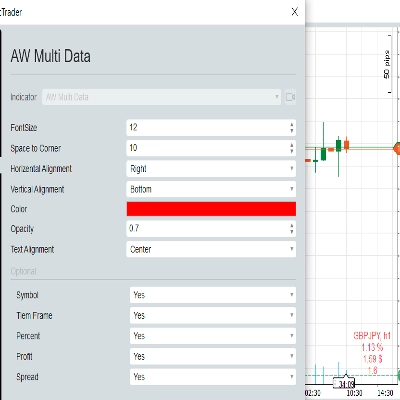
mostra simbolo e intervallo di tempo, percentuale di profitto netto giornaliero, profitto netto giornaliero e spread nel tuo grafico.

considera che il fuso orario è impostato su UTC per mostrare correttamente il profitto giornaliero.

Riepilogo

Riepilogo AI
IR Multi Data is a trading indicator that displays key trading metrics directly on your chart. It shows the symbol and timeframe, daily net profit percentage, daily net profit amount, and spread. The indicator requires the timezone to be set to UTC to accurately reflect daily profit values. This tool is designed to provide traders with quick access to essential performance data within their charting environment.
Profilo indicatore

Discussioni

Recensioni dei clienti

5.0
Recensioni: 1
5
100 %
4
0 %
3
0 %
2
0 %
1
0 %
Recensioni dei clienti
September 3, 2025
اختيار موفق لك الحمد

Domande frequenti

I prodotti disponibili tramite cTrader Store, inclusi bot di trading, indicatori e plugin, sono forniti da sviluppatori terzi e resi disponibili esclusivamente a scopo informativo e di accesso tecnico. cTrader Store non è un broker e non fornisce consulenze in materia di investimento, raccomandazioni individualizzate o garanzie di risultati futuri.

Altro da questo autore

with this indicator you could see other time frame candle in your chart.
show spread on chart
some user add moving average to macd to see better. in ctrader 4.3.11 there is a problem with this . I make a macd tha
this indicator show macd on chart.
Multi Time Frame Moving Average is a powerful and flexible indicator for cTrader
 this moving include everything that a trader needs from Moving Average.
this indicaotr show distance between Tenkan to Kijun, Close to Kijun and Close to Tenkan 
Add Slowing to IR Moving Average.
IR Candle Open plots customizable opening price lines for daily, weekly, and monthly candles
Coral indicator
you could put your check list in your chart you could split your test with “,” you could put your checklist in indicat
this indicator show other time frame close in lower time frame. for ex: show daily close in m 15.

Potrebbe interessarti anche

🚀 MACD Pro Trader – Advanced MACD with buy/sell signals, custom MAs & color-coded histograms for smarter trading! 📈🔥
Trend-filtered signals, transparent trade plans and a multi-timeframe decision panel for cTrader.
Renko scalping indicator
Deep Mood Distribution (DMD) is a segmented volume-profile and sentiment tool that analyzes price action in fixed bar bl
Explore 88 harmonic price-pattern variants with interactive chart controls and geometric reference levels.
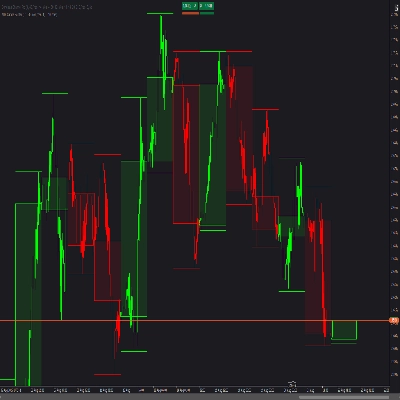
Overlay HTF context on any chart: color bars by HTF and draw filled HTF bodies with optional High/Low lines.
View tick activity across a selected chart range with Point of Control, Value Area High and Value Area Low.
Trades Opening Range Breakouts Indicator with dynamic stops/targets adapting to market volatility.
The Advanced CCI & EMA Indicator combines the CCI with 40 & 80 EMA logic to generate precise arrows signaling direction
FVG Multi Time Frame Indicator
The cTrader Chaos Reversals indicator brings high-quality reversal signals to traders.
Tracks NY, London, Tokyo, Sydney sessions with custom visuals, and a real-time expanding range box and breakout High/Low
Fimathe Indicator - Fimathe PCM - Automated Trend Channels & Levels — Ideal for live trading and backteting
Trading.FC$_vwap Algo shows VWAP trends, dynamic support/resistance and deviation bands to spot potential trade entries.
Order block
BB20 MULTICOLOR
Bar Time Timeframe / Renko
Protect your funded account. Real-time Daily Equity Drawdown monitor with Green / Orange / Red flashing alerts.

Prezzo

5.63K
Installazioni gratuite