
Daily Open Color Zones
Indicador
344 transferências
Versão 1.0, Sep 2025
Windows, Mac
4.0
Avaliações: 1
Descrição
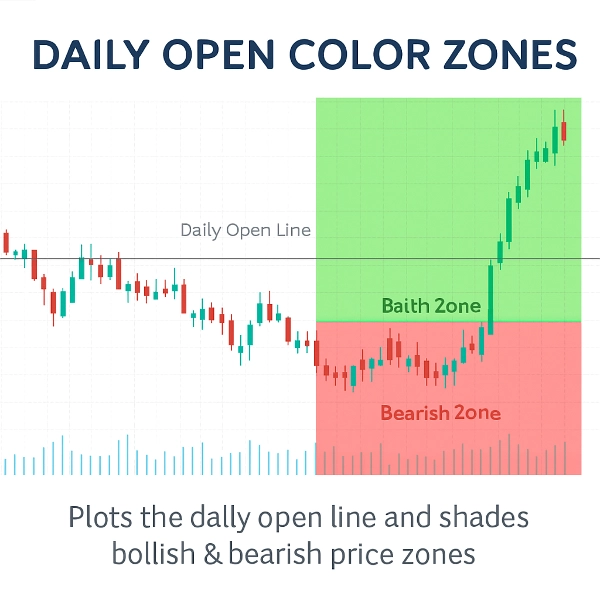
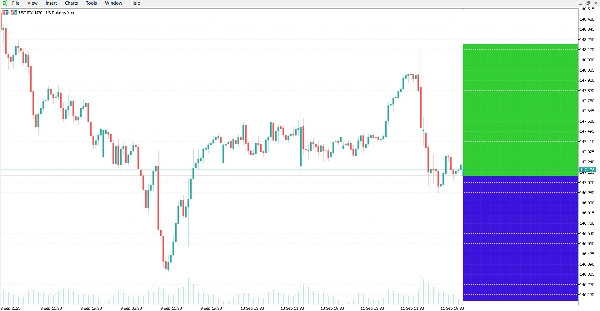
Este indicador traça a Linha de Abertura Diária e sombreia as zonas de preço de alta e baixa ao seu redor.
Ele fornece uma referência visual clara para ver se o mercado está negociando acima ou abaixo da abertura diária, que é um nível comumente usado na análise intradiária.
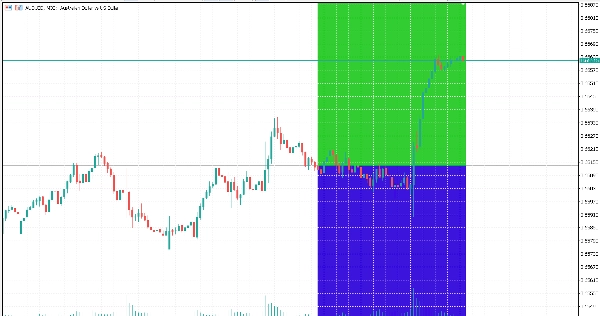
O indicador desenha automaticamente uma linha horizontal no preço de abertura diária e destaca as áreas do gráfico:
- Zona verde acima da linha (área de alta).
- Zona vermelha abaixo da linha (área de baixa).
Características:
- Linha de Abertura Diária Automática: plotagem precisa do preço de abertura diária.
- Zonas de Cor: distinga facilmente áreas de alta e baixa com cores personalizáveis.
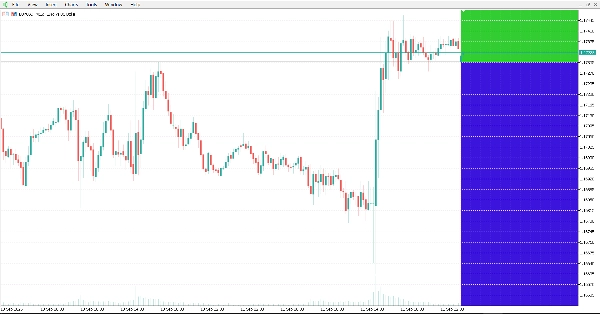
- Atualizações Dinâmicas: as zonas se ajustam automaticamente a cada novo candle.
- Aparência personalizável: estilo da linha, espessura e cores das zonas podem ser modificados.
- Leve e eficiente: projetado para uso mínimo da CPU.
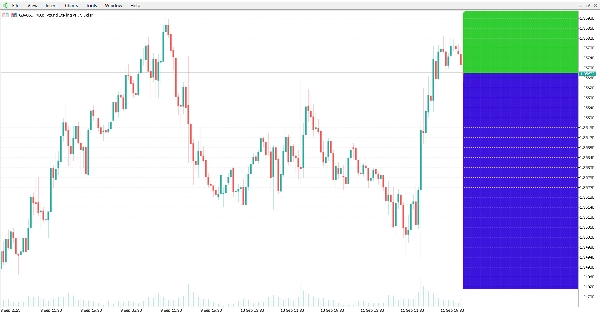
- Funciona em todos os símbolos e intervalos de tempo.
Conclusão:
O indicador oferece uma visualização clara no gráfico da abertura diária e das zonas relacionadas de alta/baixa. Pode ser aplicado a diferentes mercados e intervalos de tempo para análise técnica.
Resumo
Resumo de IA
The Daily Open Color Zones indicator visually marks the daily open price on trading charts by automatically plotting a horizontal line at this level. It shades the price area above the daily open line in green to indicate bullish zones and the area below in red to indicate bearish zones. These color-coded zones update dynamically with each new candle, providing real-time visual cues about market direction relative to the daily open. The indicator supports all symbols and timeframes, making it applicable across various markets including Forex, cryptocurrencies, and commodities like gold (XAUUSD). Users can customize the line style, thickness, and zone colors to suit their preferences. Designed to be lightweight, it minimizes CPU usage while offering clear intraday reference points commonly used in technical analysis and scalping strategies.
Perfil do indicador
Avaliações de clientes
4.0
Avaliações: 1
5 | 0 % | |
4 | 100 % | |
3 | 0 % | |
2 | 0 % | |
1 | 0 % |
Avaliações de clientes
October 20, 2025
Clean and visual 🎨 - Daily Open Zones make trend bias crystal clear. Great tool for intraday planning and momentum entries!
Conversa
Perguntas frequentes
Forex
Scalping
EURUSD
Crypto
Grid
XAUUSD
Os produtos disponíveis através da cTrader Store, incluindo bots de negociação, indicadores e plugins, são fornecidos por programadores terceiros e são disponibilizados apenas para fins informativos e de acesso técnico. A cTrader Store não é um corretor e não fornece aconselhamento em matéria de investimento, recomendações pessoais ou qualquer garantia de desempenho no futuro.


Preço
Desde 13/09/2025
27
Vendas
5.36K
Instalações gratuitas