
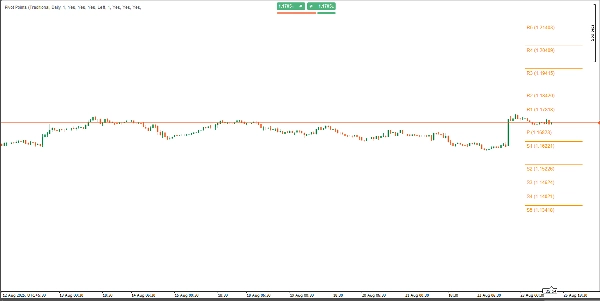
Pivot Point Daily Indicator
Indicador
14 compras
Versión 2.0, May 2026
Windows, Mac
4.2
Valoraciones: 4
Descripción
Características clave:
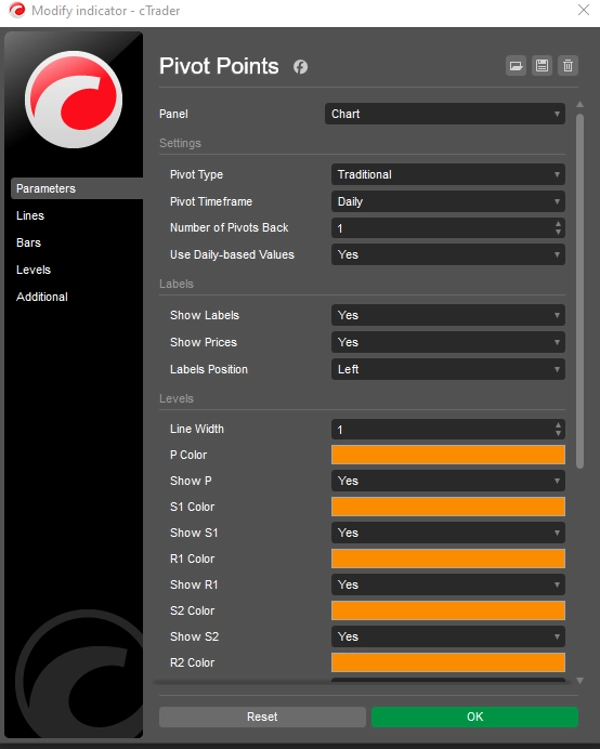
- Múltiples estilos de pivote: Cambie sin problemas entre seis métodos de cálculo de pivote: Clásico, Fibonacci, Woodie, Camarilla, DM y Tradicional. Cada método admite diferentes niveles (hasta R5/S5 para Tradicional y Camarilla, R3/S3 para Fibonacci y P/R1/S1 para DM).
- Marcos de tiempo flexibles: Elija entre una amplia gama de marcos de tiempo de pivote, incluyendo Auto, Diario, Semanal, Mensual, Trimestral, Anual y opciones multianuales (Bianual, Trienal, Quinquenal, Decenal). Perfecto para alinearse con su horizonte de trading.
- Control histórico de pivotes: Configure el número de conjuntos históricos de pivotes para mostrar (1–200) con el parámetro Número de Pivotes Atrás, asegurando un gráfico sin desorden mientras conserva niveles históricos clave.
- Apariencia personalizable: Colores, anchos de línea y configuraciones de etiquetas totalmente ajustables. Active o desactive etiquetas y valores de precio, y elija la posición de las etiquetas (Izquierda o Derecha) con desplazamientos verticales inteligentes para mayor claridad.
- Datos diarios o intradía: Opción de usar valores basados en datos diarios o en el marco temporal del gráfico, proporcionando flexibilidad para diferentes estrategias de trading.
- Rendimiento optimizado: Código nativo ligero de cTrader que garantiza actualizaciones rápidas en tiempo real sin retrasos, compatible con Forex, índices, materias primas, criptomonedas y más.
¿Por qué elegir Pivot Points Standard?
- Herramienta de trading versátil: Identifique niveles clave de soporte/resistencia, direcciones de tendencia y oportunidades de ruptura en cualquier mercado o marco temporal.
- Interfaz fácil de usar: Menús desplegables intuitivos para tipo de pivote, marco temporal y posición de etiquetas que facilitan la personalización.
- Análisis histórico: Visualice hasta 200 conjuntos históricos de pivotes para estudiar interacciones pasadas de precios y perfeccionar su estrategia.
- Gráficos limpios: Posicionamiento inteligente de etiquetas y longitudes de línea personalizables que evitan el desorden en el gráfico, mejorando la legibilidad.
Cómo usar:
- Aplique el indicador a su gráfico de cTrader.
- Seleccione su Tipo de Pivote preferido (por ejemplo, Fibonacci, Camarilla) y el Marco Temporal del Pivote (por ejemplo, Diario, Mensual).
- Ajuste el Número de Pivotes Atrás para controlar los conjuntos históricos mostrados.
- Personalice colores, anchos de línea y configuraciones de etiquetas según su estilo.
- Utilice los niveles de pivote para identificar soporte/resistencia, establecer stop-loss/take-profit o operar rupturas.
Ideal para:
- Operadores diarios: Aproveche pivotes diarios o semanales para entradas y salidas intradía.
- Operadores swing: Use pivotes mensuales o trimestrales para capturar tendencias a largo plazo.
- Scalpers: Combine con marcos de tiempo más bajos para operaciones rápidas y precisas.
- Todos los mercados: Funciona perfectamente en Forex, acciones, criptomonedas y materias primas.
Impulsa tu confianza en el trading
Con Pivot Points Standard, obtienes acceso a una herramienta poderosa y todo en uno que simplifica el análisis técnico y mejora tu capacidad para detectar oportunidades de trading de alta probabilidad. Ya seas un principiante o un trader experimentado, este indicador se adapta a tu estrategia, proporcionando niveles claros y accionables para elevar tu desempeño en el trading. ¡Prueba Pivot Points Standard hoy y toma el control de tu trading con precisión y claridad! Pago único. Acceso de por vida. Actualizaciones futuras incluidas.
Resumen
Resumen de IA
Pivot Point Daily Indicator is a multi-timeframe pivot point tool designed for the cTrader platform. It supports six pivot calculation methods—Classic, Fibonacci, Woodie, Camarilla, DM, and Traditional—each offering various resistance and support levels (up to R5/S5 for some methods). Users can select from a broad range of timeframes including Auto, Daily, Weekly, Monthly, Quarterly, Yearly, and multi-year intervals, allowing alignment with different trading horizons.
The indicator allows displaying up to 200 historical pivot sets to analyze past price interactions while maintaining chart clarity through customizable label positions and line settings. It offers options to use daily-based or intraday data, enhancing flexibility for diverse trading strategies.
Pivot Point Daily Indicator is optimized for real-time performance with native cTrader coding, compatible across Forex, indices, commodities, cryptocurrencies, and other markets. Its interface includes intuitive dropdown menus for pivot type, timeframe, and label customization.
Traders can use this indicator to identify key support and resistance levels, trend directions, and breakout opportunities, aiding in setting stop-loss and take-profit points. It suits various trading styles including day trading, swing trading, and scalping across multiple asset classes.
Perfil del indicador
Categoría del indicador
Soporte y resistencia
Tipo de resultado
Filtro
Requisitos de datos
Únicamente barras
Señales admitidas
Ruptura de nivel
Valoraciones de clientes
4.2
Valoraciones: 4
5 | 25 % | |
4 | 75 % | |
3 | 0 % | |
2 | 0 % | |
1 | 0 % |
Valoraciones de clientes
May 2, 2026
Bought it, added it, used it for a while, and now it's disappeared, and I cannot get it back!
August 28, 2025
Good helper for review if the trader wants it keeps attention on levels that actually matter. It works best as support, not a final decision maker. The cleanest use is 3 to 5 levels per chart, with 0.5 pullbacks checked before entry. not every zone holds, even if it looks clean.
August 27, 2025
August 27, 2025
Usable tool with purpose for traders who build plans around market levels. It gives value around key price zones, but not every zone holds, even if it looks clean. I would wait for 2 reactions and avoid trades where the target is less than 1.5R. Levels are useful when they reduce noise, not when they crowd the chart.
Conversación
Preguntas frecuentes
Fibonacci
Prop
Forex
Breakout
Indices
Commodities
Los productos disponibles a través de cTrader Store, incluidos bots, indicadores y plugins para operar, son proporcionados por desarrolladores de terceros y están disponibles únicamente con fines informativos y de acceso técnico. cTrader Store no es un bróker, por lo que no proporciona asesoramiento de inversión, recomendaciones personales ni ninguna garantía de rentabilidad futura.


Precio
Desde 30/05/2025
40
Ventas