
Opis
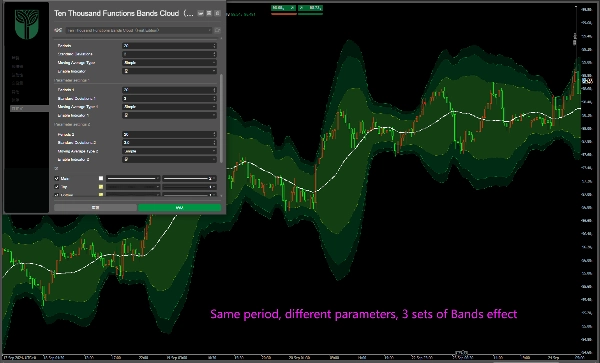
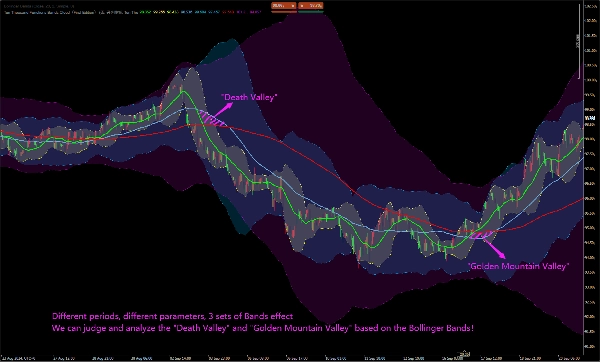
Standardowe 3 grupy pasm:
okres:20
Odchylenia:2.0;3.0; 3.5;
Wzbogacone o tło chmurowe!
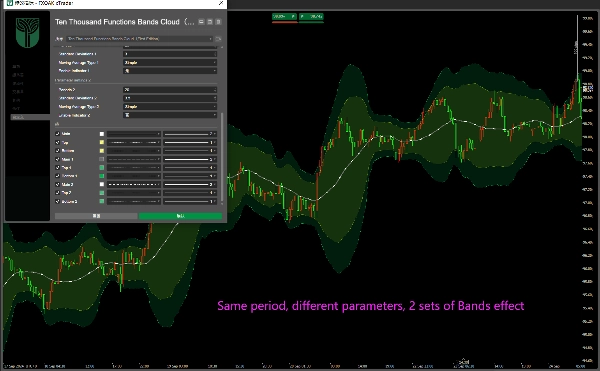
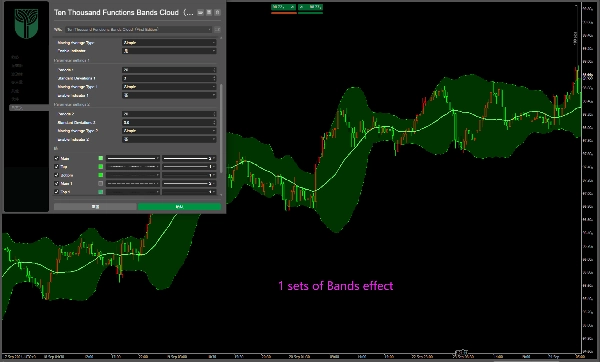
Możesz zamknąć lub otworzyć dowolną jedną lub dwie grupy; oraz można modyfikować i ustawiać różne parametry!
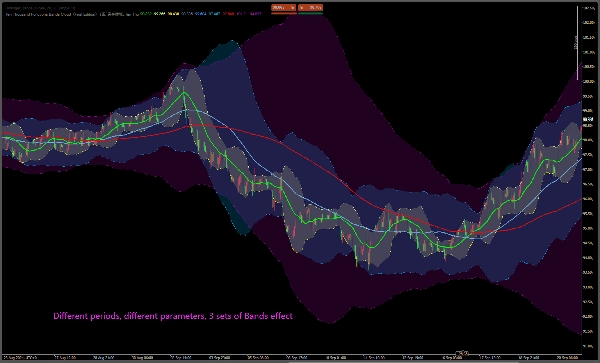
Można je również zmienić na inne wartości, takie jak 2.0:20, 60, 144 pasm;
Środkowy tor pasm jest równy średniej kroczącej, czyli średnim kroczącym 20, 60 i 144!
Możemy ocenić i analizować "Dolinę Śmierci" i "Złotą Dolinę" na podstawie środkowego toru pasm Bollingera!
常规3组Bands:
周期:20
偏差:2.0;3.0; 3.5;
支持云背景!
您可以关闭或打开任意一个或两个组;并且可以修改和设置不同的参数!
它也可以修改为其他值,如2.0:20、60、144布林带;
Bands中轨等于移动平均线,即20、60和144移动平均线!
我们可以根据布林中轨迹来判断和分析“死亡谷”和“金山谷”等......
標準3グループボリンジャーバンド(Bands):期間:20;偏差値:2.0;3.0;3.5;クラウドバックグラウンドに対応!任意の1グループまたは2グループをオン/オフ設定することが可能です。また、各パラメーターの修正と設定も行えます。他の数値に変更することも可能です。例えば2.0の偏差値で、期間20、60、144のボリンジャーバンドに設定するなど。ボリンジャーバンドの中線は移動平均線に等しく、すなわち期間20、60、144の移動平均線です。ボリンジャーバンドの中線に基づいて、「デッドバレー(死亡谷)」や「ゴールドバレー(金山谷)」などを判断・分析することができます。
Стандартные 3 группы Бандов (Полос Боллинджера): Период: 20; Отклонение: 2,0; 3,0; 3,5; Поддержка облачного фона! Вы можете отключить или включить любую одну или две группы; кроме того, вы можете изменять и настраивать различные параметры! Его также можно изменить на другие значения, например, Боллинджеры с отклонением 2,0 и периодами 20, 60, 144; Средняя линия Бандов равна скользящей средней, то есть скользящим средним с периодами 20, 60 и 144! Мы можем определять и анализировать такие явления, как «Мёртвая долина» и «Золотая долина», на основе средней линии 。
Podsumowanie
Opinie klientów
5 | 100 % | |
4 | 0 % | |
3 | 0 % | |
2 | 0 % | |
1 | 0 % |


