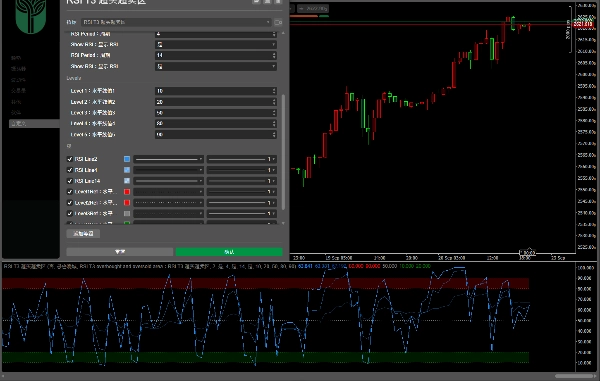
Brokerzy i firmy proptradingowe
Dla firm
00
Days
:
00
Hours
:
00
Minutes
:
00
Seconds
Wskaźnik
VWAP
ZigZag
RSI
FVG
ATR
Fibonacci
Supertrend
MACD
Bollinger
RSI T3 overbought and oversold area
02/10/2025
1
Desktop
Od 11/09/2024
Sprzedaż
4
Bezpłatne instalacje
58
Przesłany obraz „RSI T3 overbought and oversold area”

Three-Parameter RSI with Overbought/Oversold Zones
(Parameters and overbought/oversold zones can be adjusted independently; each cycle line can be turned on or off separately), facilitating the observation of multi-cycle resonance:

• Trend Consistency:
The short-, medium-, and long-cycle RSI move in the same direction. If the short-cycle RSI stays above the medium- and long-cycle RSI, it indicates a bullish trend; otherwise, it indicates a bearish trend.

• Divergence and Reversal:
When the price hits a new high/low but the short-cycle RSI fails to follow suit, and the medium- and long-cycle RSI weakens/recovers, it signals a potential pullback/rally.

• Overbought/Oversold Confirmation:
When a single-cycle RSI enters the overbought or oversold zone, judgment should be combined with other cycles; if multiple cycles enter the overbought or oversold zone simultaneously, the signal is more reliable.

• Cycle Resonance:
When multiple-cycle RSI send the same signal (e.g., all breaking through the 50 midline), the probability of the trend continuing or reversing is higher, which can assist in decision-making.


带超买超卖区域的三参数 RSI

(可自主调整参数与超买超卖区域,支持单独开关各周期线),便于观察多周期共振:


•趋势一致性:

短、中、长周期 RSI 同向运行,短周期在中长周期上方为多头趋势;反之则为空头趋势。

•背离与反转:

价格创新高 / 低但短周期 RSI 未同步,且中长周期 RSI 走弱 / 回升,提示可能回调 / 反弹。

•超买超卖确认:

单周期超买超卖时,需结合其他周期判断;多周期同时超买超卖,信号更可靠。

•周期共振:

多周期 RSI 同发信号(如均突破 50 中轴线),趋势延续或反转的概率更高,可辅助决策。

0.0
Opinie: 0
Opinie klientów
Ten produkt nie ma jeszcze opinii. Wypróbowałeś(-aś) go już? Bądź pierwszy(-a) i powiedz o tym innym!
Więcej od tego autora
Zigzag T3
Three ZigZag lines
zh-cn Variety Period clock panel(multilanguage)
This indicator can be used to: change color, shape size, position, change font, increase or decrease, and other function
Wskaźnik
NAS100
NZDUSD
RSI
+13
Ten Thousand Functions Bands Cloud(First Edition)
A metric that can set 1 to 3 groups of Bollinger Bands
zh-cn Variety Period time panel(multilanguage)
This indicator can be used to: change color, shape size, position, change font, increase or decrease, and other function
Wskaźnik
ZigZag
VWAP
RSI
+6
RSI T3 Overbought and oversold areas
Three parameter RSI
Możesz także polubić
Rsi buy Sell Signal
Instant‑setup RSI scalper—designed for turbulent markets.
Wskaźnik
Grid
NAS100
NZDUSD
+19
Supertrend-algo
Algorithmic trend precision for cTrader.
Wskaźnik
Forex
Signal
MACD
swingh6
Swing-Trading Indicaotr for pairs like EUR/USD, AUD/USD, and USD/JPY. Most effective on higher time frames H4,H6,H12...
Wskaźnik
NAS100
NZDUSD
XAUUSD
+14
Volume Profile Pivot Anchored
Anchor volume profiles to pivots with POC, VAH, VAL and real-time insights for clearer trade decisions.
Wskaźnik
Indices
Prop
Breakout
+3
RVI
A precision-crafted indicator that compares current volume to its historical average for the same time of day.
Candles_Painter
Overlay HTF context on any chart: color bars by HTF and draw filled HTF bodies with optional High/Low lines.
Wskaźnik
Indices
Stocks
Commodities
+2
SymbolTFOverlay
The SymbolTFOverlay display the current symbol and timeframe as a semi-transparent text overlay on the chart.
Vice TrendTrading
Unlike most indicators that show signals blindly, this show valid entries inside TREND ZONES and visual trend BACKTESTS.
mIntrinsicRecursiveValue
Intrinsic Recursive Value Indicator
R S
This indicator is a simple, single-timeframe tool for showing candle sentiment directly on your chart. If you want a mor
zh-cn Variety Period clock panel(multilanguage)
This indicator can be used to: change color, shape size, position, change font, increase or decrease, and other function
Wskaźnik
NAS100
XAUUSD
Breakout
+12
Daily Weekly Monthly - Highs & Lows
Daily/Weekly/Monthly - Highs & Lows Indicator (Customizable Settings)
Wskaźnik
Indices
Stocks
Forex
+1
TwoSMA.cs
An indicator that accurately shows the trend direction. A vital tool for clear trading decisions.
Wskaźnik
Grid
NAS100
NZDUSD
+19
Trend Cycle
Trend Cycle – measure the life of your trends. See how long the current move has been running and how long similar trend
Wskaźnik
RSI
Indices
Stocks
+3
FiboTrend-Pro V2
New version of one of my favorites includes Fibonacci and moving average convergence divergence lines
Najwyżej oceniane
Za darmo
FairValueGap
This Fair Value Gap (FVG) indicator is a technical analysis tool used to identify potential price imbalances.
session final
Comprehensive time session indicator
Wskaźnik
NAS100
RSI
NZDUSD
+13
Stochastic RSI PRO
Unlock Stochastic RSI PRO in cTrader! Overlay RSI, highlight zones, and identify divergences with customizable settings.