
Series - FXMaster
Indicatore
3 acquisti
Versione 1.0, Jul 2025
Windows, Mac
4.6
Recensioni: 3

Descrizione
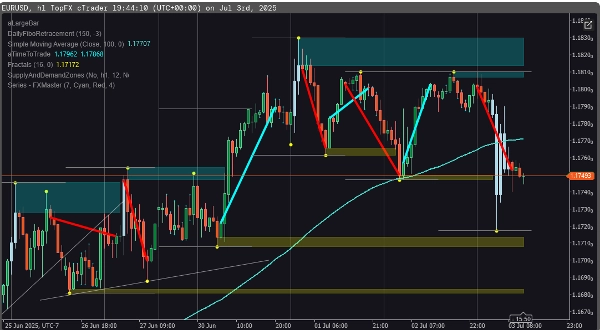
Scopri tendenze ad alta probabilità con precisione. L'indicatore Multi-Symbol Trendlines rileva serie di Massimi Crescenti / Minimi Crescenti / Chiusure Alte o Minimi Decrescenti / Massimi Decrescenti / Chiusure Basse, offrendoti una chiara e personalizzabile visione di tendenze rialziste e ribassiste—su qualsiasi simbolo di mercato.
🚀 Caratteristiche principali
- Rilevamento della sequenza di tendenza: Individua sequenze rialziste o ribassiste basate su modelli consecutivi della struttura dei prezzi.
- Soglie personalizzabili: Imposta quanti barre sono necessarie per confermare una tendenza valida—regolalo per adattarlo alla tua strategia.
- Linee di tendenza visive: Disegna automaticamente linee di tendenza direttamente sul tuo grafico—colorate per tendenze rialziste e ribassiste.
🎯 A chi è rivolto
- Trader di Price Action che si affidano alla struttura e al ritmo più che agli indicatori.
- Follower di tendenza in cerca di una conferma precoce della struttura.
- Osservatori Multi-Simbolo che necessitano di uno strumento per dominarli tutti.
Riepilogo
Riepilogo AI
The Series - FXMaster indicator identifies high-probability trends by detecting sequences of price action patterns such as Higher Highs, Higher Lows, High Closes, Lower Lows, Lower Highs, and Low Closes. It provides clear, customizable insights into uptrends and downtrends across any market symbol, including Forex, indices, commodities, cryptocurrencies, and stocks. Key features include trend sequence detection to spot bullish or bearish patterns based on consecutive price structures, customizable thresholds allowing users to set the number of bars required to confirm a trend, and automatic drawing of color-coded trendlines directly on charts for visual clarity. This tool is designed for price action traders who prioritize market structure and rhythm, trend followers seeking early confirmation of trends, and multi-symbol watchers who require a unified indicator for multiple markets.
Profilo indicatore
Recensioni dei clienti
4.6
Recensioni: 3
5 | 67 % | |
4 | 33 % | |
3 | 0 % | |
2 | 0 % | |
1 | 0 % |
Recensioni dei clienti
July 14, 2025
The opening read should not drive the whole decision, but it is just a support layer.
July 8, 2025
The journal has a cleaner path, but it works better with a written plan.
Discussioni
Domande frequenti
Forex
Indices
Commodities
Crypto
Stocks
I prodotti disponibili tramite cTrader Store, inclusi bot di trading, indicatori e plugin, sono forniti da sviluppatori terzi e resi disponibili esclusivamente a scopo informativo e di accesso tecnico. cTrader Store non è un broker e non fornisce consulenze in materia di investimento, raccomandazioni individualizzate o garanzie di risultati futuri.


Prezzo
Da 11/01/2025
19
Vendite