
Pivot Point Daily Indicator
Indikator
14 pembelian
Versi 2.0, May 2026
Windows, Mac
4.2
Ulasan: 4
Penerangan
Ciri Utama:
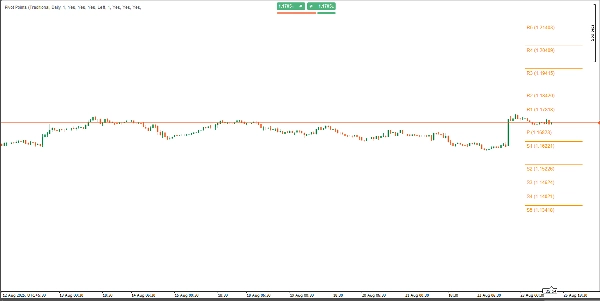
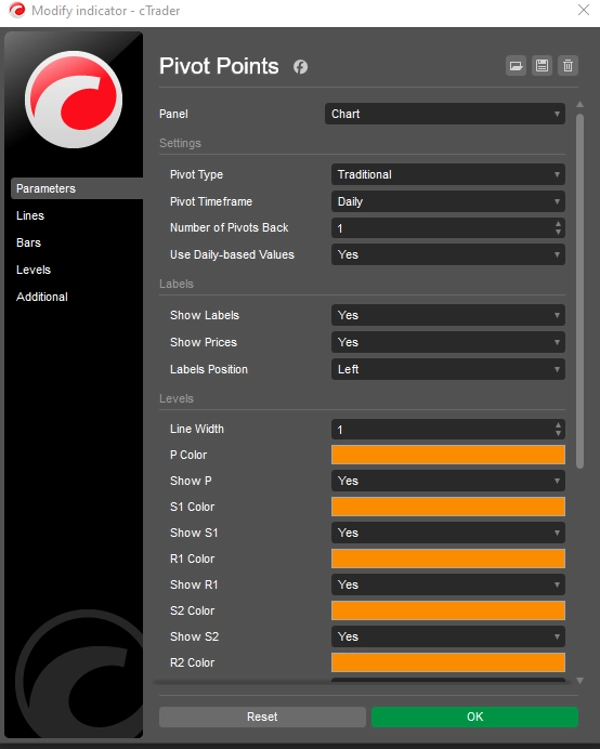
- Pelbagai Gaya Pivot: Beralih dengan lancar antara enam kaedah pengiraan pivot: Klasik, Fibonacci, Woodie, Camarilla, DM, dan Tradisional. Setiap kaedah menyokong tahap yang berbeza (sehingga R5/S5 untuk Tradisional dan Camarilla, R3/S3 untuk Fibonacci, dan P/R1/S1 untuk DM).
- Jangka Masa Fleksibel: Pilih dari pelbagai jangka masa pivot, termasuk Auto, Harian, Mingguan, Bulanan, Suku Tahunan, Tahunan, dan pilihan berbilang tahun (Biyearly, Triyearly, Quinquennially, Decennially). Sesuai untuk diselaraskan dengan horizon perdagangan anda.
- Kawalan Pivot Sejarah: Tetapkan bilangan set pivot sejarah yang dipaparkan (1–200) dengan parameter Bilangan Pivot Kembali, memastikan carta tidak sesak sambil mengekalkan tahap sejarah utama.
- Penampilan Boleh Disesuaikan: Warna, lebar garis, dan tetapan label yang boleh laras sepenuhnya. Hidupkan atau matikan label dan nilai harga, serta pilih kedudukan label (Kiri atau Kanan) dengan offset menegak pintar untuk kejelasan.
- Data Harian atau Intraday: Pilihan untuk menggunakan nilai berasaskan harian atau data jangka masa carta, memberikan fleksibiliti untuk strategi perdagangan yang berbeza.
- Prestasi Dioptimumkan: Kod cTrader asli yang ringan memastikan kemas kini masa nyata yang pantas tanpa kelewatan, serasi dengan Forex, indeks, komoditi, kripto, dan banyak lagi.
Mengapa Memilih Pivot Points Standard?
- Alat Perdagangan Serbaguna: Kenal pasti tahap sokongan/rintangan utama, arah aliran, dan peluang pecahan di mana-mana pasaran atau jangka masa.
- Antara Muka Mesra Pengguna: Menu lungsur intuitif untuk jenis pivot, jangka masa, dan kedudukan label memudahkan penyesuaian.
- Analisis Sejarah: Visualisasikan sehingga 200 set pivot sejarah untuk mengkaji interaksi harga lalu dan memperbaiki strategi anda.
- Carta Bersih: Kedudukan label pintar dan panjang garis yang boleh disesuaikan mengelakkan kekacauan carta, meningkatkan kebolehbacaan.
Cara Menggunakan:
- Terapkan penunjuk pada carta cTrader anda.
- Pilih Jenis Pivot pilihan anda (contoh, Fibonacci, Camarilla) dan Jangka Masa Pivot (contoh, Harian, Bulanan).
- Laraskan Bilangan Pivot Kembali untuk mengawal set sejarah yang dipaparkan.
- Sesuaikan warna, lebar garis, dan tetapan label mengikut gaya anda.
- Gunakan tahap pivot untuk mengenal pasti sokongan/rintangan, tetapkan stop-loss/take-profit, atau berdagang pecahan.
Sesuai Untuk:
- Pedagang Harian: Manfaatkan pivot Harian atau Mingguan untuk kemasukan dan keluar intraday.
- Pedagang Swing: Gunakan pivot Bulanan atau Suku Tahunan untuk menangkap trend jangka panjang.
- Scalpers: Gabungkan dengan jangka masa lebih rendah untuk perdagangan cepat dan tepat.
- Semua Pasaran: Berfungsi dengan lancar merentasi Forex, saham, kripto, dan komoditi.
Tingkatkan Keyakinan Perdagangan Anda
Dengan Pivot Points Standard, anda mendapat akses kepada alat serba boleh yang memudahkan analisis teknikal dan meningkatkan keupayaan anda untuk mengenal pasti peluang perdagangan berkemungkinan tinggi. Sama ada anda seorang pemula atau pedagang berpengalaman, penunjuk ini menyesuaikan dengan strategi anda, menyediakan tahap yang jelas dan boleh diambil tindakan untuk meningkatkan permainan perdagangan anda.Cuba Pivot Points Standard hari ini dan kawal perdagangan anda dengan ketepatan dan kejelasan!Bayaran sekali sahaja. Akses seumur hidup. Kemas kini masa depan disertakan.
Ringkasan
Ringkasan AI
Pivot Point Daily Indicator is a multi-timeframe pivot point tool designed for the cTrader platform. It supports six pivot calculation methods—Classic, Fibonacci, Woodie, Camarilla, DM, and Traditional—each offering various resistance and support levels (up to R5/S5 for some methods). Users can select from a broad range of timeframes including Auto, Daily, Weekly, Monthly, Quarterly, Yearly, and multi-year intervals, allowing alignment with different trading horizons.
The indicator allows displaying up to 200 historical pivot sets to analyze past price interactions while maintaining chart clarity through customizable label positions and line settings. It offers options to use daily-based or intraday data, enhancing flexibility for diverse trading strategies.
Pivot Point Daily Indicator is optimized for real-time performance with native cTrader coding, compatible across Forex, indices, commodities, cryptocurrencies, and other markets. Its interface includes intuitive dropdown menus for pivot type, timeframe, and label customization.
Traders can use this indicator to identify key support and resistance levels, trend directions, and breakout opportunities, aiding in setting stop-loss and take-profit points. It suits various trading styles including day trading, swing trading, and scalping across multiple asset classes.
Profil indikator
Kategori indikator
Sokongan & rintangan
Jenis output
Tapis
Keperluan data
Bar sahaja
Isyarat yang disokong
Pecahan paras
Ulasan pelanggan
4.2
Ulasan: 4
5 | 25 % | |
4 | 75 % | |
3 | 0 % | |
2 | 0 % | |
1 | 0 % |
Ulasan pelanggan
May 2, 2026
Bought it, added it, used it for a while, and now it's disappeared, and I cannot get it back!
August 28, 2025
Good helper for review if the trader wants it keeps attention on levels that actually matter. It works best as support, not a final decision maker. The cleanest use is 3 to 5 levels per chart, with 0.5 pullbacks checked before entry. not every zone holds, even if it looks clean.
August 27, 2025
August 27, 2025
Usable tool with purpose for traders who build plans around market levels. It gives value around key price zones, but not every zone holds, even if it looks clean. I would wait for 2 reactions and avoid trades where the target is less than 1.5R. Levels are useful when they reduce noise, not when they crowd the chart.
Perbincangan
Soalan Lazim
Fibonacci
Prop
Forex
Breakout
Indices
Commodities
Produk yang tersedia melalui cTrader Store, termasuk bot dagangan, indikator dan plugin, disediakan oleh pembangun pihak ketiga dan diberikan akses untuk tujuan maklumat dan teknikal sahaja. cTrader Store bukan broker dan tidak memberikan nasihat pelaburan, syor peribadi atau sebarang jaminan prestasi masa hadapan.


Harga
Sejak 30/05/2025
40
Jualan