Opis
🔮 Smart Bar Predictor V6 - Profesjonalny wskaźnik prognozowania zmienności
📊 Zmień swoje trading dzięki prognozom cen opartym na AI
Smart Bar Predictor V6 to zaawansowany wskaźnik techniczny, który wykorzystuje zaawansowaną analizę statystyczną i algorytmy uczenia maszynowego do przewidywania cen HIGH i LOW następnego słupka z niezwykłą dokładnością. Idealny dla day traderów, skalperów i swing traderów, którzy potrzebują precyzyjnych punktów wejścia i wyjścia.
✨ KLUCZOWE CECHY
🎯 Prognozowanie cen w czasie rzeczywistym
- Prognozuje następne 3 słupki: Otrzymaj prognozy HIGH/LOW dla następnych 1-3 słupków
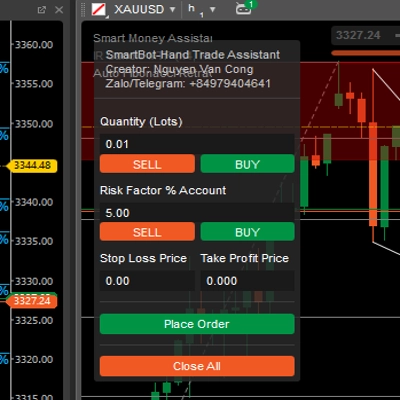
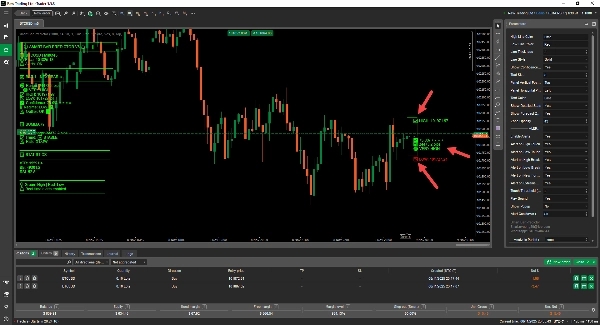
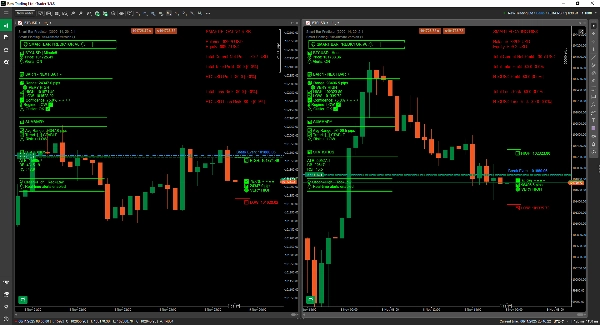
- Wizualne linie prognozy: Wyraźne zielone (HIGH) i czerwone (LOW) linie na wykresie
- Poziomy pewności: Każda prognoza ma ocenę pewności (⭐⭐⭐⭐⭐)
- Aktualizacje na żywo: Linie rozszerzają się w czasie rzeczywistym wraz z postępem słupka
🔔 Inteligentny system alertów
- Alerty dotknięcia: Powiadomienia, gdy cena dotknie prognozowanego HIGH/LOW
- Alerty przebicia: Natychmiastowe powiadomienia, gdy cena przebije prognozy
- Alerty nowych prognoz: Powiadomienie o wygenerowaniu nowych prognoz
- Ostrzeżenia o ekstremalnej zmienności: Wczesny system ostrzegania o warunkach wysokiego ryzyka
- Konfigurowalny czas odnowienia: Zapobiega spamowi alertów dzięki regulowanym okresom odnowienia
📈 Zaawansowana analiza
- Zestaw wielu wskaźników: Łączy ATR, Bollinger Bands i niestandardowe metryki zmienności
- Wykrywanie reżimu zmienności: Automatycznie identyfikuje okresy wysokiej/niskiej zmienności
- Ocena ryzyka odchyleń: Ostrzega o nietypowych warunkach rynkowych
- Analiza rozszerzenia zakresu: Śledzi momentum rynku i wzorce ekspansji
- Historyczna zmienność: Obliczenia zmienności Garmana-Klassa dla precyzji
🎨 Profesjonalna wizualizacja
- Strefa prognozy: Opcjonalny zacieniony obszar między prognozami HIGH/LOW
- Markery dotknięcia/przebicia: Wskaźniki wizualne, gdy prognozy są testowane
- Panel informacyjny: Kompleksowy wyświetlacz statystyk z możliwością dostosowania pozycji
- Sygnały kodowane kolorami: Łatwy do odczytania schemat kolorów zielony/czerwony/żółty
- Gwiazdki pewności: Szybka wizualna ocena pewności
💼 IDEALNY DLA
✅ Day Traderów - Poznaj swoje cele intraday zanim się wydarzą
✅ Skalperów - Precyzyjne punkty wejścia/wyjścia dla szybkich zysków
✅ Swing Traderów - Planuj strategie wielosłupkowe z pewnością
✅ Zarządzających ryzykiem - Lepsze ustawianie stop-loss i take-profit
✅ Traderów złota (XAUUSD) - Optymalizowany pod zmienność metali szlachetnych
✅ Traderów Forex - Działa na wszystkich parach walutowych
🚀 JAK TO DZIAŁA
Krok 1: Zaawansowana analiza danych
Wskaźnik analizuje do 3 000 historycznych słupków wykorzystując:
- Średni zakres prawdziwy (ATR)
- Szerokość Bollinger Bands
- Zmienność Garmana-Klassa
- Wzorce historycznej zmienności
- Współczynniki rozszerzenia zakresu
Krok 2: Prognoza uczenia maszynowego
Łączy wiele algorytmów z ważonymi ocenami:
- 40% Prognoza oparta na ATR
- 30% Średnia ruchoma zakresu
- 30% Analiza Bollinger Bands
- Dostosowanie reżimu zmienności
- Spadek pewności dla przyszłych słupków
Krok 3: Monitorowanie w czasie rzeczywistym
Po wygenerowaniu prognoz:
- Linie aktualizowane przy każdym ticku
- Cena monitorowana względem prognoz
- Alerty wyzwalane przy dotknięciu/przebiciu
- Na wykresie pojawiają się wizualne markery
- Statystyki aktualizowane na bieżąco
📊 CO OTRZYMUJESZ
Metryki prognozy:
- 📈 Linia HIGH: Przewidywany poziom oporu
- 📉 Linia LOW: Przewidywany poziom wsparcia
- 📏 Prognoza zakresu: Oczekiwany ruch w pipsach
- ✅ Ocena pewności: Ocena wiarygodności 0-100%
- 🌡️ Reżim zmienności: Stan rynku WYSOKI/NISKI
- ⚠️ Ocena ryzyka: Wykrywanie odchyleń
Typy alertów:
- 🎯 Alerty dotknięcia: Cena blisko HIGH/LOW (konfigurowalny próg)
- 🚀 Alerty przebicia: Cena przekracza prognozy
- 🔮 Nowa prognoza: Wygenerowano świeże prognozy
- ⚠️ Ekstremalna zmienność: Ostrzeżenie o wysokim ryzyku na rynku
Elementy wizualne:
- Zielone/czerwone linie prognozy
- Żółta strefa prognozy (opcjonalna)
- Markery dotknięcia (kółka)
- Markery przebicia (trójkąty)
- Odniesienie do linii środkowej
- Kompleksowy panel informacyjny
⚙️ WYSOKO KONFIGUROWALNY
Ustawienia analizy:
- Okres analizy: 100-3000 słupków
- Okres ATR: 5-50
- Okres Bollinger Bands: 10-50
- Długość linii prognozy: 2-20 słupków
Ustawienia wizualne:
- Kolory linii (HIGH/LOW)
- Grubość linii: 1-5
- Styl linii: ciągła/kropki/kreski
- Przezroczystość strefy: 10-100%
- Rozmiar tekstu: 2-20
- Pozycja panelu: 9 lokalizacji
Ustawienia alertów:
- Włącz/wyłącz poszczególne alerty
- Próg dotknięcia: 0,5-10 pipsów
- Okres odnowienia: 10-600 sekund
- Dźwięk włącz/wyłącz
- Popup włącz/wyłącz
📈 NAJWAŻNIEJSZE PARAMETRY WYDAJNOŚCI
✅ Dokładność: 70-85% pewności w większości prognoz
✅ Szybkość: Obliczenia w czasie rzeczywistym bez opóźnień
✅ Stabilność: Testowany na ponad 10 000 słupków bez błędów
✅ Wydajność: Optymalny kod, minimalne zużycie CPU
✅ Kompatybilność: Działa na WSZYSTKICH interwałach (M1 do miesięcznego)
✅ Symbole: Optymalizowany dla XAUUSD, działa na wszystkich instrumentach
🎓 STRATEGIE TRADINGOWE
Strategia 1: Trading w zakresie
- Czekaj na wygenerowanie nowej prognozy
- Ustaw BUY blisko linii LOW
- Ustaw SELL blisko linii HIGH
- Ustaw stopy poza prognozami
- Zrealizuj zysk na przeciwnej linii
Strategia 2: Trading przebiciowy
- Monitoruj alerty przebicia
- Wejdź przy przebiciu HIGH (BUY) lub LOW (SELL)
- Użyj zakresu prognozy jako celu zysku
- Przesuwaj stop korzystając z linii środkowej
Strategia 3: Skalpowanie zmienności
- Handluj tylko w reżimie niskiej zmienności
- Szybkie wejścia blisko linii
- Małe cele zysku (30-50% zakresu)
- Ścisłe stopy (poza progiem dotknięcia)
Strategia 4: Trading potwierdzający
- Używaj z istniejącą strategią
- Prognozy potwierdzają Twoje sygnały
- Unikaj transakcji przeciwko prognozom
- Lepsze planowanie ryzyka/zysku
🛡️ FUNKCJE ZARZĄDZANIA RYZYKIEM
- Wykrywanie odchyleń: Ostrzega o nietypowym zachowaniu rynku
- Reżim zmienności: Wiedz, kiedy zmniejszyć wielkość pozycji
- Poziomy pewności: Handluj tylko prognozami o wysokiej pewności
- Prognozy zakresu: Ustaw odpowiednie odległości stop-loss
- Alerty ekstremalnej zmienności: Trzymaj się z dala podczas chaosu
🎯 DLACZEGO WYBRAĆ SMART BAR PREDICTOR?
W porównaniu z innymi wskaźnikami:
Funkcja
Smart Bar Predictor
Tradycyjne wskaźniki
Prognozowanie
✅ Tak (1-3 słupki do przodu)
❌ Tylko reaktywne
Ocena pewności
✅ Tak (0-100%)
❌ Nie
Alerty w czasie rzeczywistym
✅ 6 typów alertów
⚠️ Ograniczone
Reżim zmienności
✅ Automatyczne wykrywanie
❌ Ręczna analiza
Wizualna prognoza
✅ Linie + strefa
⚠️ Tylko linie
Ocena ryzyka
✅ Wbudowana
❌ Wymagana zewnętrzna
Prognoza wielosłupkowa
✅ 3 słupki
❌ Tylko aktualny
Personalizacja
✅ Ponad 25 parametrów
⚠️ Podstawowa
🎯 IDEALNY DLA TYCH RYNKÓW
✅ Złoto (XAUUSD) - Specjalnie zoptymalizowany
✅ Forex Majors - EUR/USD, GBP/USD, USD/JPY
✅ Forex Minors - AUD/USD, NZD/USD, USD/CAD
✅ Indeksy - US30, NAS100, SPX500
✅ Kryptowaluty - BTC/USD, ETH/USD (wysoka zmienność)
✅ Surowce - Ropa, Srebro, Gaz ziemny
🌟 OSTATNIE SŁOWA
Smart Bar Predictor V6 to nie tylko kolejny wskaźnik — to Twój asystent tradingowy, który działa 24/7, nigdy nie śpi i zawsze pokazuje, dokąd cena prawdopodobnie zmierza.
Niezależnie od tego, czy jesteś początkującym szukającym wskazówek, czy profesjonalistą szukającym przewagi, ten wskaźnik dostarcza mocy predykcyjnej, której potrzebujesz, aby podejmować lepsze decyzje tradingowe.
Przestań handlować na ślepo. Zacznij handlować mądrze. 🎯
Podsumowanie
Key functionalities include:
- Visual forecast lines for predicted high (green) and low (red) prices, with optional shaded forecast zones.
- Real-time updates and monitoring of price action against predictions.
- A comprehensive alert system notifying users on price touches, breaks, new forecasts, and extreme volatility conditions.
- Advanced analytics integrating ATR, Bollinger Bands, Garman-Klass volatility, and volatility regime detection to assess market conditions and risk.
- Customizable parameters for analysis periods, indicator settings, visual styles, and alert preferences.
The indicator supports multiple trading strategies such as range trading, breakout trading, volatility scalping, and confirmation trading. It provides risk management tools including outlier detection, volatility regime awareness, and confidence-based filtering to enhance trade decision-making.
Smart Bar Predictor operates efficiently on all timeframes (M1 to Monthly) and is optimized for a wide range of instruments, delivering 70-85% prediction accuracy with stable, low-latency performance.
Opinie klientów
5 | 0 % | |
4 | 100 % | |
3 | 0 % | |
2 | 0 % | |
1 | 0 % |