
Golden Boom And Crash Spike Detector
Wskaźnik
15 zakupy
Wersja 2.0, Apr 2026
Windows, Mac
5.0
Opinie: 3
Opis
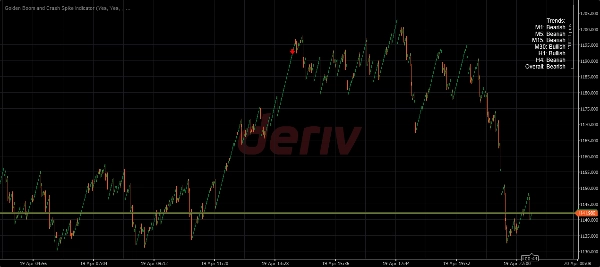
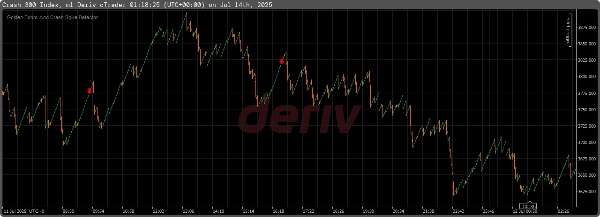
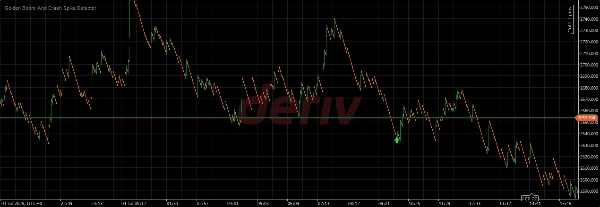
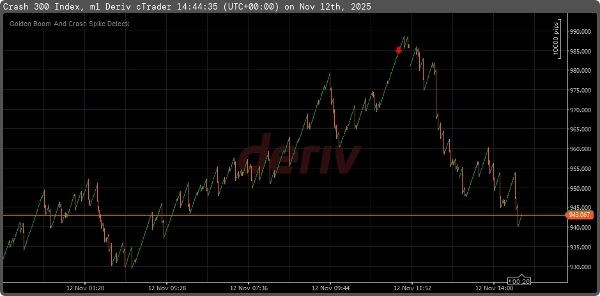
Golden Boom and Crash Spike Detector to zaawansowany wskaźnik handlu syntetycznego, który łączy własnościowe wykrywanie skoków oparte na sztucznej inteligencji oraz analizę ruchu cen, aby dostarczać sygnały handlowe o wysokim prawdopodobieństwie z niezrównaną dokładnością.
- Ważne (Używaj tylko na Crash 300, Boom 300 (M1, interwał jednosekundowy))
- Identyfikuje skoki o wysokim prawdopodobieństwie za pomocą nieprzemalowujących się strzałek kupna/sprzedaży na wykresie
- Wysyła powiadomienia na telefon i komputer
- Działa na brokerze Deriv
- Minimalny depozyt 30 USD
- Wyświetla kierunek trendu od M1 do H4
- Wysyła poziomy stop loss, take profit (Tp1, Tp2, Tp3) oraz kierunek trendu na telefon i komputer
- Wyświetla na ekranie okna wiadomości oraz standardowe powiadomienia popup
- Odtwarza dźwięk powiadomienia, gdy generowany jest nowy sygnał
Podsumowanie
Podsumowanie AI
Golden Boom and Crash Spike Detector is a trading indicator designed specifically for the Crash 300 and Boom 300 indices on the 1-minute (M1) timeframe. It uses AI-driven spike detection combined with price action analysis to identify high-probability market spikes. The tool provides non-repainting buy and sell arrows directly on the chart, helping traders spot potential entry points. It integrates with Deriv platforms and supports sending notifications—including stop loss, take profit levels (Tp1, Tp2, Tp3), and trend direction—from M1 up to H4 timeframes to both phone and computer. The indicator also features on-screen message boxes, standard pop-up alerts, and sound notifications when new signals are generated. It requires a minimum deposit of $30 on the Deriv broker. This tool is intended to assist traders focusing on synthetic indices by delivering timely and actionable spike signals with trend context.
Profil wskaźnika
Opinie klientów
5.0
Opinie: 3
5 | 100 % | |
4 | 0 % | |
3 | 0 % | |
2 | 0 % | |
1 | 0 % |
Opinie klientów
July 17, 2025
Simple market helper for a more controlled workflow. It helps with handling gold setups with more structure, but gold can move fast, so DD and position sizing matter a lot. For gold, I would use 0.5 percent risk, a 1.5R target and DD under 3 percent before scaling. I would still keep manual review in the process.
July 16, 2025
July 16, 2025
Not bad for a trial around gold trading. The useful part is handling gold setups with more structure, with the numbers checked before scaling. The setup is easier to judge after 25 XAUUSD trades, especially if ROI sits around 4 to 6 percent. Gold volatility can make one bad trade expensive, so a 1 percent cap per trade feels sensible.
Dyskusja
Częste pytania
Forex
Signal
Indices
SMC
BOS
AI
Produkty dostępne za pośrednictwem cTrader Store, w tym boty handlowe, wskaźniki i wtyczki, dostarczane są przez deweloperów zewnętrznych i udostępniane wyłącznie w celach informacyjnych oraz w celu zapewnienia dostępu technicznego. cTrader Store nie jest brokerem i nie zapewnia doradztwa inwestycyjnego, nie udziela spersonalizowanych rekomendacji ani nie gwarantuje przyszłych wyników.
Więcej od tego autora


Cena
32
Sprzedaż