
Opis
Podręcznik użytkownika WinSMC
1. Cel
`WinSMC` to nakładkowy wskaźnik SMC dla cTrader. Pomaga wizualnie zidentyfikować:
- Zmiany struktury rynku
- `BOS` (Break of Structure)
- `MSS` (Market Structure Shift)
- `Order Blocks`
- `Liquidity Grabs` / `Sweeps`
- `FVG` (Fair Value Gaps)
Nie jest to system automatycznego handlu. To narzędzie do analizy struktury i kontekstu, najlepiej używane do handlu opartego na potwierdzeniach.
2. Podstawowe pojęcia
Długość huśtawki
`Swing Length` kontroluje, jak daleko w lewo i prawo musi być potwierdzony pivot, zanim zostanie uznany za ważny punkt huśtawki.
Praktyczne wskazówki:
- Mniejsze wartości = więcej sygnałów, więcej szumu
- Większe wartości = mniej sygnałów, czystsza struktura
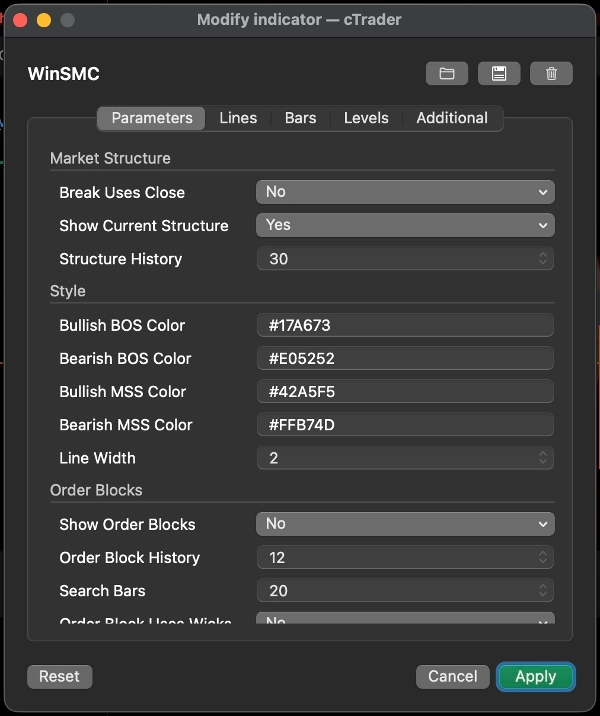
Break Uses Close
To ustawienie decyduje, czy przełamanie struktury jest potwierdzane przez:
- `Tak`: zamknięcie świecy
- `Nie`: przełamanie knota/minimum/maksimum
Wskazówki:
- Używaj zamknięcia dla bardziej konserwatywnego podejścia
- Używaj przełamań knota dla wcześniejszego, bardziej czułego wykrywania
Pokaż aktualną strukturę
Pokazuje aktualne aktywne linie swing high i swing low, pomagając zobaczyć, czego rynek nadal przestrzega.
Historia struktury
Kontroluje, ile linii i etykiet przełamań struktury jest przechowywanych na wykresie.
3. BOS i MSS
BOS
`BOS` oznacza, że cena kontynuuje w tym samym kierunku i przebija poprzednie maksimum lub minimum.
Typowa interpretacja:
- W trendzie wzrostowym przebicie poprzedniego maksimum to byczy BOS
- W trendzie spadkowym przebicie poprzedniego minimum to niedźwiedzi BOS
MSS
`MSS` oznacza, że rynek zmienił kierunek względem poprzedniego nastawienia.
Typowa interpretacja:
- Jeśli cena była niedźwiedzia i przebija poprzednie maksimum, to jest byczy MSS
- Jeśli cena była bycza i przebija poprzednie minimum, to jest niedźwiedzi MSS
Zastosowanie w handlu
- `BOS` jest bardziej ukierunkowany na kontynuację trendu
- `MSS` jest bardziej ukierunkowany na odwrócenie
- Najlepsze wejścia zwykle pochodzą z retestu `Order Block` lub `FVG`
4. Order Blocks
`Order Block` to ostatnia przeciwna świeca przed przełamaniem struktury. Zwykle traktowana jako strefa reakcji podaży/popytu.
Pokaż Order Blocks
Po włączeniu wskaźnik cofa się po `BOS` lub `MSS` i rysuje strefę ostatniej przeciwnej świecy.
Znaczenie
- Byczy OB: po byczym przełamaniu używana jest ostatnia niedźwiedzia świeca
- Niedźwiedzi OB: po niedźwiedzim przełamaniu używana jest ostatnia bycza świeca
Gdy cena zaczyna wchodzić w interakcję ze strefą, jest ona oznaczana jako zmitigowana.
Order Block Uses Wicks
To kontroluje, jak szeroko jest rysowane pole:
- `Tak`: użyj pełnego zakresu świecy, szersza strefa
- `Nie`: użyj węższej strefy rdzeniowej
Wskazówki:
- Używaj `Tak` dla szerszej, bardziej konserwatywnej strefy
- Używaj `Nie` dla węższej, bardziej precyzyjnej strefy
Strategia Order Block
Typowy przebieg pracy:
1. Czekaj na `BOS` lub `MSS`
2. Oznacz odpowiadający OB
3. Czekaj na retest
4. Szukaj potwierdzenia przed wejściem
Nie traktuj OB jako gwarantowanego punktu odwrócenia. To obszar o wysokim zainteresowaniu, nie pewność.
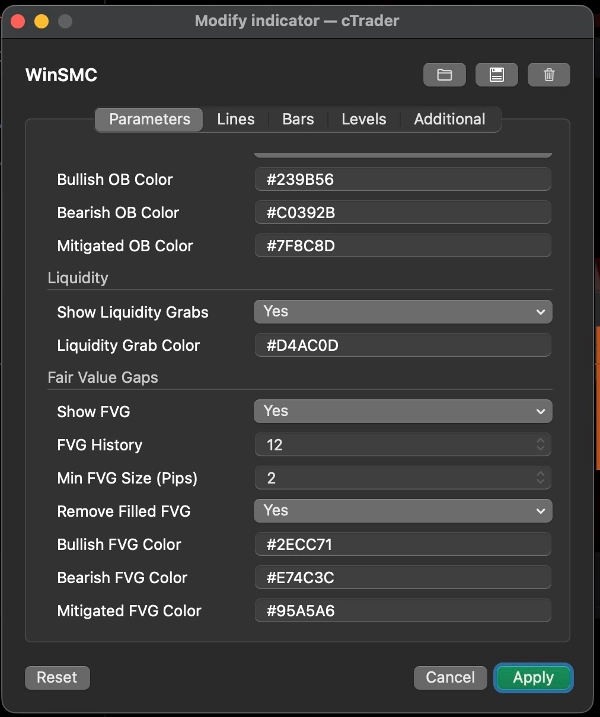
5. Liquidity Grabs / Sweeps
`Liquidity Grab` oznacza, że cena przebiega powyżej poprzedniego maksimum lub poniżej poprzedniego minimum, a następnie zamyka się z powrotem wewnątrz.
W tym wskaźniku:
- `Buy-side sweep`: cena przebija poprzednie maksimum i zamyka się poniżej niego
- `Sell-side sweep`: cena przebija poprzednie minimum i zamyka się powyżej niego
Zwykle oznacza to, że rynek zebrał płynność i może przygotowywać się do kolejnego ruchu.
Ważne
Sam sweep nie jest sygnałem handlowym.
Lepiej traktować go jako:
- Ostrzeżenie, że płynność została zabrana
- Wskazówkę do ustawienia
- Powód, by czekać na `MSS` lub `BOS`
Typowe zastosowanie
- Po `Buy-side sweep`, niedźwiedzi `MSS` może wspierać ustawienie krótkiej pozycji
- Po `Sell-side sweep`, byczy `MSS` może wspierać ustawienie długiej pozycji
6. FVG
`FVG` to Fair Value Gap utworzona przez nierównowagę trzech świec.
Pokaż FVG
Po włączeniu wskaźnik rysuje widoczne strefy FVG.
Zasada wykrywania
- Bycza FVG: maksimum pierwszej świecy jest poniżej minimum trzeciej świecy
- Niedźwiedzia FVG: minimum pierwszej świecy jest powyżej maksimum trzeciej świecy
Minimalny rozmiar FVG (pipsy)
To filtruje bardzo małe luki.
- Jednostka: `pipsy`
- Wyższa wartość = mniej, ale bardziej znaczących FVG
- `0` = brak filtra rozmiaru
Przydatne, gdy wykres jest zagracony lub gdy bardzo małe luki 1-pikselowe nie są użyteczne w twoim workflow.
Usuń wypełnione FVG
Po włączeniu w pełni wypełnione FVG są usuwane z wykresu.
Strategia FVG
Dwa popularne podejścia:
1. Cofnięcie trendu
- Czekaj na `BOS` lub `MSS`
- Czekaj, aż cena cofnie się do FVG
- Handluj w kierunku struktury
2. Wejście oparte na potwierdzeniu
- Obserwuj sweep
- Czekaj na `MSS`
- Użyj FVG jako ostatecznej strefy cofnięcia
7. Zalecane style handlu
Strategia A: Kontynuacja trendu
Najlepsza, gdy rynek wyraźnie trenduje.
Przebieg pracy:
1. Czekaj na `BOS`
2. Oznacz OB
3. Szukaj cofnięcia do OB lub FVG
4. Wejdź dopiero po reakcji ceny
To klasyczne podejście podążające za trendem.
Strategia B: Sweep, a następnie odwrócenie
Najlepsza, gdy rynek jest zmienny i podatny na fałszywe przełamania.
Przebieg pracy:
1. Wykryj `Buy-side sweep` lub `Sell-side sweep`
2. Czekaj na przeciwny `MSS`
3. Użyj OB lub FVG jako strefy cofnięcia
4. Wejdź po potwierdzeniu
To silniejsze niż handel samym sweepem.
Strategia C: Zbieżność Sweep + MSS + OB/FVG
To jeden z najczystszych sposobów użycia wskaźnika.
Przebieg pracy:
1. Otrzymaj sweep
2. Otrzymaj MSS
3. Czekaj na retest OB lub FVG
4. Handluj tylko wtedy, gdy strefy się pokrywają
To ogranicza przedwczesne wejścia.
8. Szybkie sugestie ustawień
- `Swing Length`: zacznij od 5 lub 7
- `Break Uses Close`: włącz dla bardziej konserwatywnego widoku
- `Order Block Uses Wicks`: włącz dla szerszych stref
- `Min FVG Size (Pips)`: zacznij od 2.0 i dostosuj do instrumentu
- `Structure History` / `Order Block History` / `FVG History`: dostosuj, aby wykres był czytelny
9. Ostatnia uwaga
`WinSMC` najlepiej używać jako mapy struktury, a nie jako pojedynczego wyzwalacza sygnału.
Najbardziej wiarygodny przebieg pracy to:
- Określ kierunek trendu
- Obserwuj sweep płynności
- Czekaj na MSS lub BOS
- Użyj OB lub FVG jako strefy wejścia
- Wejdź dopiero po potwierdzeniu
Podsumowanie
The indicator helps traders analyze price action by marking swing highs and lows, confirming valid swing points based on customizable swing length, and distinguishing breaks using candle closes or wick extremes. Order Blocks are displayed as supply/demand zones derived from the last opposite candle before a structure break, with options to adjust zone width. Liquidity Sweeps indicate price movements beyond prior highs or lows that close back inside, signaling potential setups rather than direct trade signals. FVG zones are identified by three-candle imbalances and can be filtered by minimum size and removed once filled.
WinSMC supports multiple trading strategies, including trend continuation after BOS, reversal setups following liquidity sweeps and MSS, and confluence-based entries combining sweeps, MSS, and retests of Order Blocks or FVGs. It is intended as a confirmation and structure mapping tool rather than an automated trading system, aiding traders in timing entries with contextual market information.

![Logo „[CB] Pivot Points Pro”](https://cdn.ctrader.com/image/webp/43463c82-67b0-4f10-a4ba-901bba091d81_32594)


