

AI Supertrend MTF
Wskaźnik
3 zakupy
Wersja 1.0, Jul 2026
Windows, Mac

534.4M
Wolumen transakcji
9.76M
Zysk w pipsach
4
Sprzedaż
Opis
Przegląd:
Zmęczony tradycyjnym wskaźnikiem Supertrend, który nie nadąża za nagłymi zmianami na rynku? AI Supertrend MTF przełamuje schematy śledzenia trendów, integrując algorytm uczenia maszynowego K-Nearest Neighbors (K-NN). Nieustannie uczy się na podstawie najnowszych ruchów cen (RSI, ATR, Momentum) i automatycznie dostosowuje swoją czułość, eliminując fałszywe sygnały na niestabilnych rynkach, jednocześnie natychmiast wychwytując duże wybicia.
Kluczowe cechy:
- 🤖 Silnik uczenia maszynowego: Wykorzystuje rozszerzającą się bazę pamięci oraz dynamiczne ważenie cech, aby odróżnić prawdziwe trendy od szumu rynkowego.
- 📊 Projekcja wieloczasowa (MTF): Zobacz szerszy obraz! Rzutuj do DWÓCH wyższych interwałów czasowych (np. 1H i Dzienny) bezpośrednio na wykresie bieżącego niższego interwału. Zaprojektowany z rygorystyczną logiką bitową, gwarantującą ZERO przemalowań i brak wycieków danych przyszłych.
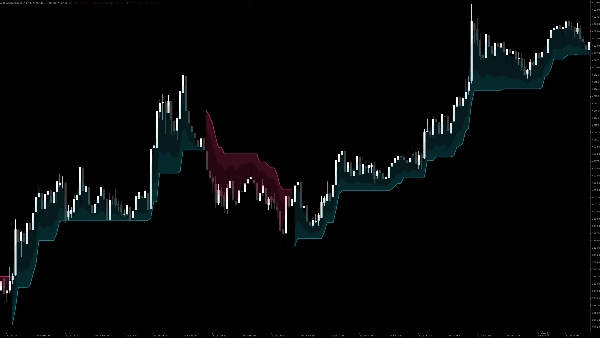
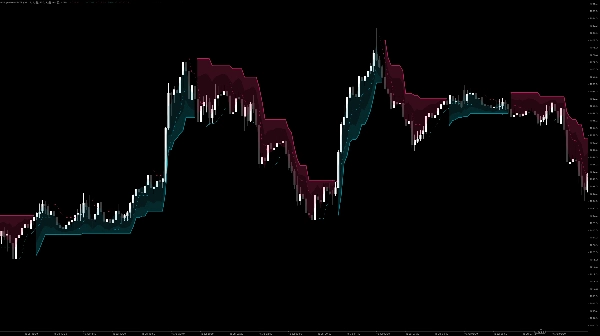
- ✨ Dynamiczne świecące chmury: Oszałamiająca wizualna aktualizacja. Wyświetla gładkie, nieinwazyjne 3-warstwowe gradientowe chmury, które wizualnie wskazują siłę oraz strefy wsparcia/oporu bieżącego trendu.
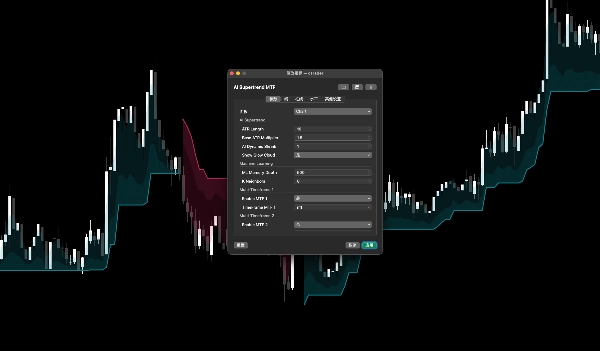
- ⚙️ Wysoka konfigurowalność: Dostosuj głębokość pamięci AI, liczbę K-sąsiadów oraz szczegółowość MTF bezpośrednio z natywnego panelu parametrów cTrader.
Jak używać (instrukcja obsługi):
- Dołącz do wykresu: Zastosuj wskaźnik do wybranego interwału czasowego. Główna linia trendu natychmiast pokaże aktualny kierunek obliczony przez AI.
- Włącz MTF (opcjonalnie): Przewiń w dół w ustawieniach do
Multi-Timeframe 1iMulti-Timeframe 2. Zaznacz pole "Enable" i wybierz pożądane wyższe interwały czasowe. Pojawią się przerywane linie pokazujące makrotrend. - Strategia handlowa:
-
- Sygnał kupna: Gdy główna linia trendu zmienia kolor na cyjan (poniżej ceny) ORAZ linie wyższych interwałów MTF również są cyjanowe (wyrównanie trendów).
- Sygnał sprzedaży: Gdy główna linia trendu zmienia kolor na czerwony (powyżej ceny) ORAZ linie wyższych interwałów MTF również są czerwone.
- Wyjście: Użyj świecących pasm chmur jako dynamicznych poziomów trailing stop-loss.
Podsumowanie
AI summary
AI Supertrend MTF is a trend-following indicator that integrates a K-Nearest Neighbors (K-NN) machine learning algorithm to reduce lag and false signals typical of traditional Supertrend indicators. It continuously learns from recent price action metrics including RSI, ATR, and momentum, adapting its sensitivity to distinguish true trends from market noise and to capture breakouts promptly.
Key features include multi-timeframe (MTF) projection, allowing users to overlay trend information from up to two higher timeframes onto the current chart without repainting or future data leaks. The indicator visually represents trend strength and support/resistance zones through dynamic, three-layer glowing clouds. Users can customize AI memory depth, K-neighbors, and MTF settings via the native parameter panel.
To use, apply the indicator to any timeframe to see the AI-calculated trend direction. Optional MTF lines display macro trends from higher timeframes. Buy and sell signals are generated when the main trendline and MTF lines align in color (cyan for buy, red for sell). The glowing cloud bands serve as dynamic trailing stop-loss levels.
This indicator supports visualization, signals, and filtering functions, and requires bar, tick, and volume data inputs. It is categorized under trend indicators and incorporates RSI and ATR for momentum and volatility analysis.
Key features include multi-timeframe (MTF) projection, allowing users to overlay trend information from up to two higher timeframes onto the current chart without repainting or future data leaks. The indicator visually represents trend strength and support/resistance zones through dynamic, three-layer glowing clouds. Users can customize AI memory depth, K-neighbors, and MTF settings via the native parameter panel.
To use, apply the indicator to any timeframe to see the AI-calculated trend direction. Optional MTF lines display macro trends from higher timeframes. Buy and sell signals are generated when the main trendline and MTF lines align in color (cyan for buy, red for sell). The glowing cloud bands serve as dynamic trailing stop-loss levels.
This indicator supports visualization, signals, and filtering functions, and requires bar, tick, and volume data inputs. It is categorized under trend indicators and incorporates RSI and ATR for momentum and volatility analysis.
Profil wskaźnika
Kategoria wskaźnika
Trend
Typ wyjścia
Wizualizacja
Filtr
Sygnały
Wymagania dotyczące danych
Tylko słupki
Dane tickowe
Wolumen
Obsługiwane sygnały
Przecięcie
Przełamanie
Odwrócenie trendu
Siła trendu
Zmienność
Przebicie poziomu
Opinie klientów
0.0
Opinie: 0
Opinie klientów
Ten produkt nie ma jeszcze opinii. Wypróbowałeś(-aś) go już? Bądź pierwszy(-a) i powiedz o tym innym!
Dyskusja
Częste pytania
Supertrend
RSI
ATR
Produkty dostępne za pośrednictwem cTrader Store, w tym boty handlowe, wskaźniki i wtyczki, dostarczane są przez deweloperów zewnętrznych i udostępniane wyłącznie w celach informacyjnych oraz w celu zapewnienia dostępu technicznego. cTrader Store nie jest brokerem i nie zapewnia doradztwa inwestycyjnego, nie udziela spersonalizowanych rekomendacji ani nie gwarantuje przyszłych wyników.
Więcej od tego autora






















Cena
534.4M
Wolumen transakcji
9.76M
Zysk w pipsach
4
Sprzedaż