Descripción
Sesgo de la estructura Heikin Ashi (Indicador cTrader)
Zonas automáticas de oferta y demanda con sesgo multitemporal.
Qué hace – en lenguaje sencillo
Este indicador automáticamente:
- Lee la acción del precio Heikin Ashi y detecta cambios significativos de pivote.
- Construye zonas dinámicas de soporte y resistencia alrededor de esos pivotes, usando tanto el extremo de la mecha como el cuerpo de la vela (no solo líneas aleatorias).
- Fusiona inteligentemente zonas cercanas para que veas niveles limpios y comerciables en lugar de un bosque de líneas horizontales.
- Genera un sesgo claro alcista o bajista cada vez que el precio rompe completamente la última zona de soporte o resistencia.
- Te muestra el sesgo para:
-
- Tu marco temporal del gráfico, y
- Un marco temporal superior opcional (por defecto H2) — sin dibujar desorden HTF en tu gráfico.
Resultado: de un vistazo sabes dónde están los niveles reales y si el mercado actualmente se inclina hacia arriba o hacia abajo.
El problema que resuelve
La mayoría de los traders tienen los mismos problemas:
- Las líneas de soporte/resistencia dibujadas a mano son:
-
- subjetivas,
- inconsistentes,
- y a menudo exageradas.
- Indicadores simples de “zigzag + línea horizontal”:
-
- no manejan correctamente el ancho de la zona,
- apilan niveles uno sobre otro,
- o extienden las zonas tanto que cubren la mitad del gráfico.
- El sesgo a menudo está “en tu cabeza” – no es algo que puedas ver claramente o usar de forma basada en reglas.
Este indicador está diseñado para:
- Convertir la estructura Heikin Ashi en zonas claras y objetivas,
- Darte un sesgo/tendencia basado en reglas basado en esas zonas,
- Mientras mantiene el gráfico limpio y legible.
Cómo se construyen las zonas (explicación amigable para traders)
Para cada pivote Heikin Ashi, el indicador observa una estructura de 3 velas:
- Cuando HA cambia de rojo a verde, marca un pivote de soporte.
- Cuando HA cambia de verde a rojo, marca un pivote de resistencia.
Luego construye la zona:
Zonas de soporte
- Encuentra la mecha más baja entre las 3 velas (extremo verdadero).
- Encuentra el siguiente mínimo más bajo que aún sea mayor que ese extremo.
- Usa el cuerpo de la vela (apertura/cierre) cerca de ese mínimo interno para definir el lado “comerciable” de la zona.
- Zona final de soporte:
-
- Parte inferior = extremo de la mecha baja,
- Parte superior = nivel interno basado en el cuerpo.
Zonas de resistencia
- Encuentra la mecha más alta entre las 3 velas.
- Encuentra el siguiente máximo más alto que aún sea menor que ese extremo.
- Usa el cuerpo cerca de ese máximo interno.
- Zona final de resistencia:
-
- Parte superior = extremo de la mecha alta,
- Parte inferior = nivel interno basado en el cuerpo.
Así que cada zona no es solo una banda arbitraria:
Es un rango de mecha a cuerpo que representa dónde el precio realmente rechazó o revirtió.
Lógica de fusión (por qué el gráfico se mantiene limpio)
Zonas del mismo tipo (soporte con soporte, resistencia con resistencia):
- Se tratan como unidades en una línea de tiempo.
- Solo pueden fusionarse si realmente se superponen en precio.
- La fusión es estrictamente local:
-
- Una nueva zona puede fusionarse con:
-
- la zona más reciente (una tras otra), o
- la segunda zona más reciente (+1 espacio), y
- Una “ancla” adicional detrás de eso si la nueva zona combinada ahora se superpone con la estructura previa.
Esto mantiene el comportamiento intuitivo:
- Las zonas no “se tragan” todo el historial.
- Los niveles antiguos se respetan pero no se permite que creen mega-zonas gigantes.
- La estructura local como A–B–C o A–C+D se maneja de forma controlada.
Lógica del sesgo (cómo realmente operas con él)
Para cada marco temporal (principal y HTF):
- El indicador rastrea la última zona de soporte fusionada y la última zona de resistencia fusionada.
- Luego, en cada vela cerrada:
-
- Si el precio cierra por encima de la última zona de resistencia → el sesgo se vuelve Alcista.
- Si el precio cierra por debajo de la última zona de soporte → el sesgo se vuelve Bajista.
Almacena:
- La hora del último cambio de sesgo,
- El nivel de precio en el que el precio rompió la zona.
En el gráfico, un pequeño panel de texto muestra:
Sesgo principal (H1): AlcistaCambio principal (H1): 26/11 15:00 @1.08750
Si HTF está habilitado, también verás algo como:
Sesgo HTF (H2): BajistaCambio HTF (H2): 25/11 08:00 @1.09200
También puedes activar una alerta sonora cuando el sesgo del marco temporal principal cambie.
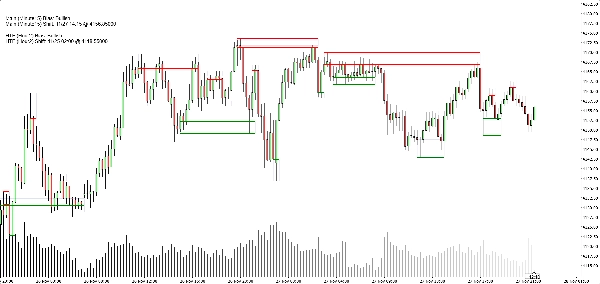
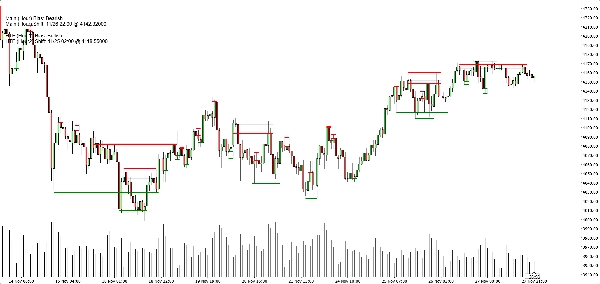
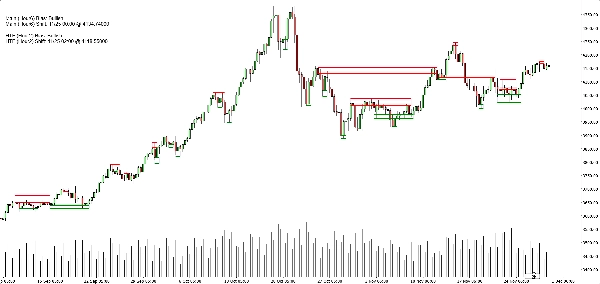
Lo que ves en el gráfico
- Zonas de soporte:
-
- Líneas base/trigger horizontales verdes (opcionales),
- Un rectángulo azul marino suave (muy baja opacidad) que muestra toda la banda de soporte.
- Zonas de resistencia:
-
- Líneas rojas + rectángulo azul marino suave para la banda.
- Controles de visualización limpia:
-
- Mostrar/ocultar zonas de soporte,
- Mostrar/ocultar zonas de resistencia,
- Encender/apagar los rectángulos rellenos,
- Encender/apagar las líneas base/trigger,
- Encender/apagar el panel de sesgo.
Esto permite que diferentes traders elijan entre:
- Un aspecto más minimalista (quizás solo rectángulos), o
- Una vista más precisa (líneas exactas visibles).
Casos de uso típicos
Puedes posicionarlo como útil para:
- Filtrado de tendencias
-
- Solo buscar compras cuando ambos sesgos de TF principal y HTF son Alcistas.
- Solo buscar ventas cuando ambos son Bajistas.
- Entradas en zonas
-
- Usar las zonas como áreas de interés para:
-
- Órdenes limitadas,
- Entradas de confirmación (por ejemplo, el precio vuelve a una zona rota y rechaza de nuevo),
- Colocación de stop justo más allá de la banda exterior.
- Análisis de arriba hacia abajo
-
- Sesgo HTF (H2 por defecto) como panorama general,
- Sesgo TF del gráfico para el timing,
- Zonas para niveles concretos de ejecución.
Lo que NO es (importante para una venta honesta)
- No es un robot que opere automáticamente por ti.
- No es una señal “santo grial” que garantice ganancias.
- Es un motor de estructura y sesgo:
-
- Define zonas objetivamente,
- Define tendencia/sesgo objetivamente basado en esas zonas,
- Deja la gestión real de la operación al trader/estrategia.
Resumen
It provides a rule-based bullish or bearish bias by tracking price breaks above resistance or below support zones on both the current chart timeframe and an optional higher timeframe. This bias is displayed on a built-in dashboard panel, with optional sound alerts for bias changes.
The indicator works across all timeframes and markets where price forms swings, including forex, crypto, stocks, and futures. It features customizable lookback periods, automatic cleanup of old zones, and toggles for display elements to suit different trader preferences.
Typical uses include trend filtering by aligning biases across timeframes, identifying zone entries for limit or confirmation orders, and supporting top-down analysis. The tool timestamps and sequences pivots and bias shifts, facilitating automation or journaling. It is a structure and bias engine that aids traders in objectively defining market levels and trends while maintaining chart clarity.
Valoraciones de clientes
5 | 33 % | |
4 | 67 % | |
3 | 0 % | |
2 | 0 % | |
1 | 0 % |