
GUPPY-MASTER V3
Wskaźnik
251 pobrania
Wersja 1.0, Mar 2026
Windows, Mac
5.0
Opinie: 3
Od 27/02/2026
33.16K
Wolumen transakcji
25.96K
Zysk w pipsach
8
Sprzedaż
391
Bezpłatne instalacje
Opis
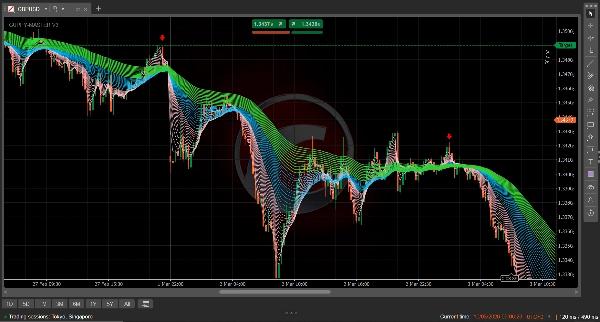
GUPPY TREND MASTER V3 (4X4 TRADING TECHNOLOGY )
Wizualizuj nastroje rynkowe za pomocą tęczy 38-EMA
Narzędzie Guppy Trend Master 4X4 to zaawansowane narzędzie analizy technicznej dla cTrader, które przekształca skomplikowane ruchy cenowe w czytelną, kolorową mapę psychologii rynku. Poprzez jednoczesne wykreślanie 38 wykładniczych średnich kroczących (EMA), pozwala traderom odróżnić tymczasowy "szum" od prawdziwych odwróceń trendu.
Logika wizualna 4X4
Wskaźnik organizuje dane rynkowe w trzy odrębne "wstęgi", aby dać Ci wielowymiarowy obraz trendu:
- Różowa wstęga (okresy 2–15): Grupa "Spekulantów". Linie te reprezentują traderów krótkoterminowych. Gdy się rozchodzą, momentum jest wysokie. Gdy się zbliżają, ruch się wyczerpuje.
- Niebieska wstęga (okresy 17–41): Grupa "Mostu". Działa jako krytyczna strefa przejściowa. Często służy jako obszar "odbicia" do ponownego wejścia podczas silnego trendu.
- Zielona wstęga (okresy 44–74): Grupa "Inwestorów". Reprezentuje długoterminowe nastroje. Szeroka, rozchodząca się zielona wstęga wskazuje na silny, stabilny trend, który trudno przełamać.
Dlaczego warto używać wskaźnika?
- Natychmiastowe potwierdzenie trendu: Zobacz na pierwszy rzut oka, czy rynek jest w trendzie, czy w konsolidacji. Jeśli wstęgi są splątane, trzymaj się z daleka. Jeśli są rozłożone i oddzielone, trend jest silny.
- Precyzyjne strefy skalpowania: Specjalnie zoptymalizowane dla interwałów M1 i M5, 4X4 podkreśla strefy "Kup na spadku" i "Sprzedaj na odbiciu" z chirurgiczną dokładnością.
- Wizualizacja zmienności: "Przerwa" między wstęgami pokazuje, jak duża jest siła stojąca za ruchem. "Czyste przerwy" (jak w logice 4X4) wskazują na środowisko handlu o wysokim prawdopodobieństwie sukcesu.
- Logika bez opóźnień: Dzięki zastosowaniu wykładniczych średnich kroczących (EMA), 4X4 reaguje na zmiany cen szybciej niż standardowe wskaźniki Guppy oparte na SMA, co czyni go lepszym dla nowoczesnych rynków wysokiej częstotliwości.
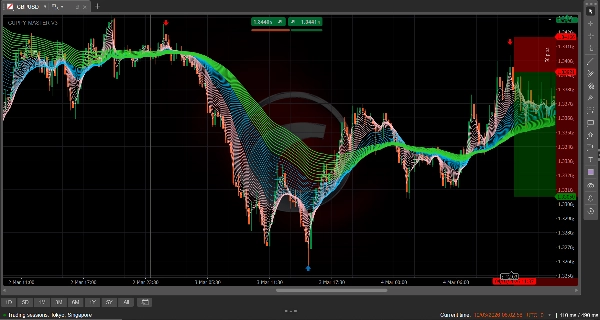
Jak czytać sygnał
- Siła byków: Różowa jest na górze, następnie niebieska, a zielona na dole. Wszystkie grupy rozchodzą się ku górze z widoczną przestrzenią między liniami.
- Siła niedźwiedzi: Zielona jest na górze, następnie niebieska, a różowa na dole. Wszystkie grupy rozchodzą się ku dołowi.
- Ściskanie: Gdy wszystkie trzy grupy zbliżają się do jednego punktu, nadchodzi potężne wybicie.
Podsumowanie
Podsumowanie AI
The GUPPY TREND MASTER V3 is a technical analysis indicator designed for the cTrader platform that visualizes market sentiment using 38 Exponential Moving Averages (EMAs). It organizes these EMAs into three color-coded ribbons to provide a multi-dimensional view of market trends: the Pink Ribbon (periods 2–15) reflects short-term speculator activity, the Blue Ribbon (periods 17–41) serves as a transitional bridge zone, and the Green Ribbon (periods 44–74) indicates long-term investor sentiment. This structure helps traders distinguish between market noise and genuine trend reversals.
Key features include instant trend confirmation by observing ribbon separation or entanglement, precision scalping zones optimized for 1- and 5-minute timeframes, and visualization of market volatility through the spacing between ribbons. The use of EMAs ensures faster reaction to price changes compared to traditional SMA-based Guppy indicators, supporting high-frequency trading environments.
Signal interpretation is based on ribbon positioning and spacing: bullish trends show Pink above Blue above Green with upward fanning, bearish trends show the reverse with downward fanning, and convergence of all ribbons signals an imminent breakout. The indicator supports various markets including forex pairs (GBPUSD, USDJPY), cryptocurrencies, stocks, and commodities like gold (XAUUSD).
Profil wskaźnika
Opinie klientów
5.0
Opinie: 3
5 | 100 % | |
4 | 0 % | |
3 | 0 % | |
2 | 0 % | |
1 | 0 % |
Opinie klientów
March 29, 2026
This is a nice indicator 😀. Overall the images are what is represented on the chart no faking. But only the arrows missing. Let me hope version 2 has them.
March 17, 2026
Very good 👍👍 indicator. Have looked for it every where finally I found it works every well
Dyskusja
Częste pytania
Signal
Breakout
Scalping
GBPUSD
Crypto
Stocks
XAUUSD
NAS100
USDJPY
Produkty dostępne za pośrednictwem cTrader Store, w tym boty handlowe, wskaźniki i wtyczki, dostarczane są przez deweloperów zewnętrznych i udostępniane wyłącznie w celach informacyjnych oraz w celu zapewnienia dostępu technicznego. cTrader Store nie jest brokerem i nie zapewnia doradztwa inwestycyjnego, nie udziela spersonalizowanych rekomendacji ani nie gwarantuje przyszłych wyników.


Cena
Od 27/02/2026
33.16K
Wolumen transakcji
25.96K
Zysk w pipsach
8
Sprzedaż
391
Bezpłatne instalacje