Opis
BUBBLEXRAY — NAJLEPSZY SKANER WOLUMENU BĄBELKÓW DLA CTRADER (WERSJA 🇧🇷 PONIŻEJ)
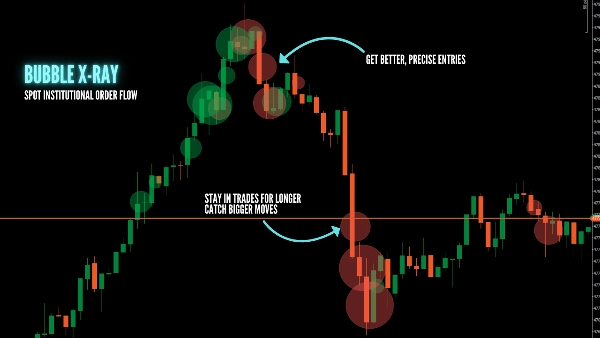
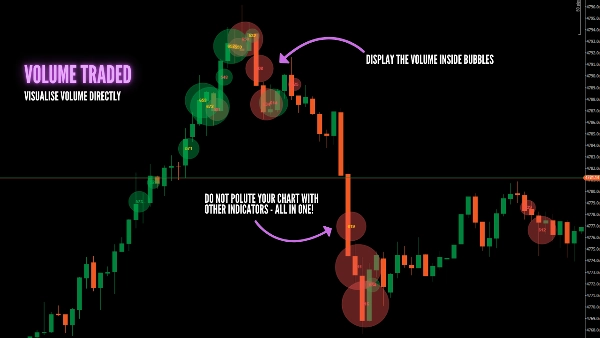
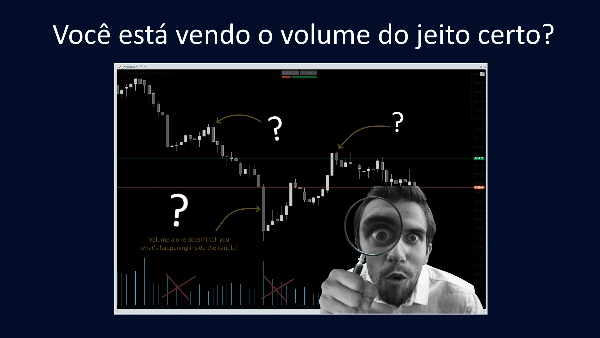
Zauważ, gdzie porusza się prawdziwe pieniądze. BubbleXRay identyfikuje skoki wysokiego wolumenu i przedstawia je jako proporcjonalne bąbelki bezpośrednio na wykresie cenowym. Wyświetla skumulowaną zmianę delty wolumenu (CVD) zintegrowaną w jednym wskaźniku, bez zaśmiecania lub zanieczyszczania wykresu. Koniec z domysłami — zobacz ślady instytucjonalne w momencie ich wystąpienia.
✅ DLACZEGO WARTO UŻYWAĆ BUBBLEXRAY?
- Natychmiastowe Skoki Aktywności: Bąbelki pojawiają się w chwili zamknięcia słupka o wysokim wolumenie.
- Ślady Instytucjonalne: Duże bąbelki na kluczowych poziomach pokazują, gdzie działają duzi gracze.
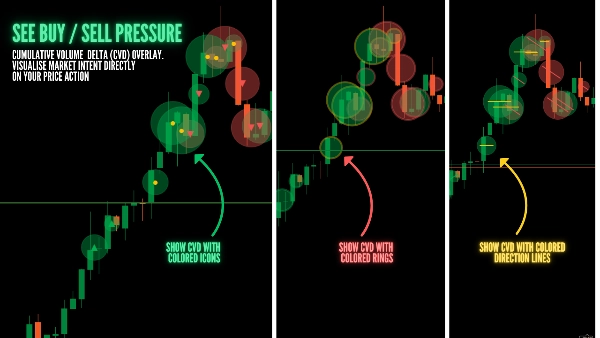
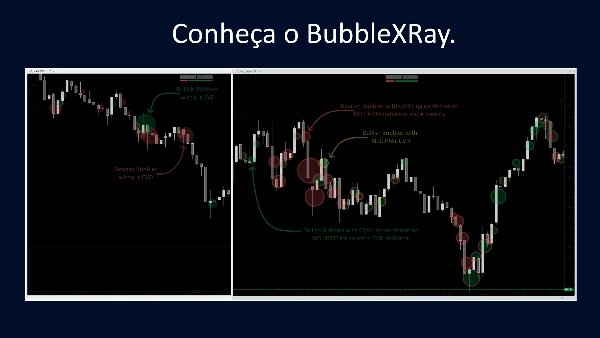
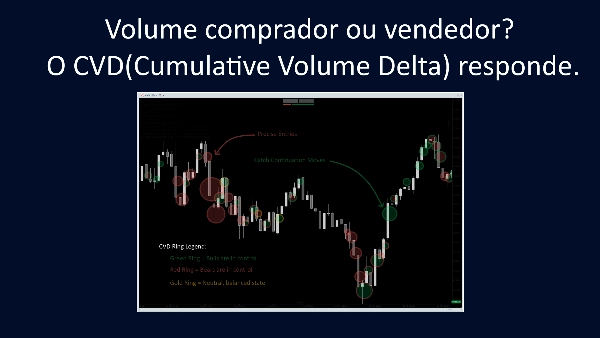
- Inteligencja CVD: Zintegrowana skumulowana delta wolumenu pokazuje, czy wzrost był efektem presji kupna czy sprzedaży.
- Automatyczne Skalowanie: Przesuwające się okno percentylowe dostosowuje się do każdej sytuacji rynkowej (trend lub konsolidacja).
- Zakotwiczenie do Ceny: Wolumen jest wyświetlany na dokładnym poziomie cenowym, a nie ukryty w histogramie pod wykresem.
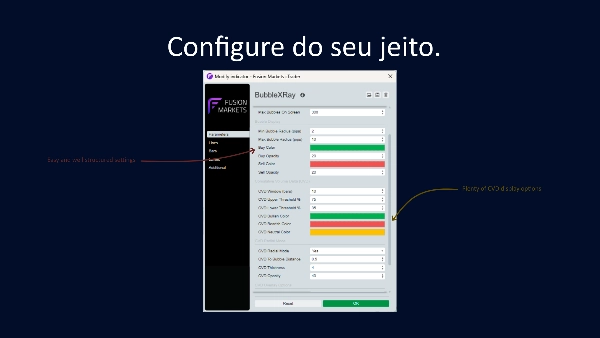
Przykładowe ustawienie: Złoto (XAUUSD) - wykres 1M
- Próg percentylu wolumenu: 80
- Okno percentylu (słupki): 250
- Maksymalna liczba bąbelków na ekranie: 20
- Minimalny promień bąbelków (pipsy): 5
- Maksymalny promień bąbelków (pipsy): 20
- Okres przesuwnej CVD (słupki): 10
- Okres patrzenia wstecz nachylenia CVD (słupki): 7
- Współczynnik płaskości CVD: 1.8
- Tryb radialny CVD: Nie
- Odległość CVD od bąbelka: 0.5
- Grubość CVD: 4
- Krycie CVD: 40
- Opcje nakładki CVD: Nie
- Tryb debugowania: Nie
📺 OBEJRZYJ SAMOUCZEK I DOŁĄCZ DO SPOŁECZNOŚCI:
(Prosimy o zamieszczanie pytań i próśb o wsparcie w komentarzach pod filmem, aby pomóc naszej społeczności rosnąć!)
🛠️ KLUCZOWE CECHY:
- Proporcjonalne Rozmiary: Rozmiar bąbelka skaluje się liniowo z wielkością wolumenu.
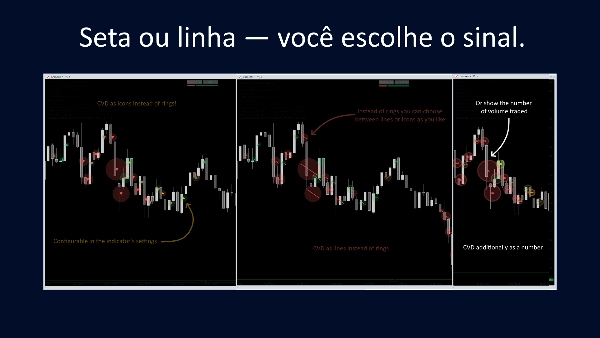
- Podwójne Potwierdzenie: Połącz pierścień radialny i strzałkę nakładki dla głębszego kontekstu CVD.
- Zero Konfiguracji: Automatycznie wybiera najlepszy interwał czasowy danych dla Twojego wykresu.
- Czysty Interfejs: Konfigurowalna przezroczystość i limity wyświetlania, aby utrzymać profesjonalny wygląd wykresów.
🇧🇷 BUBBLEXRAY — DEFINITYWNY SKANER WOLUMENU DLA CTRADER
Zidentyfikuj, gdzie działa "Smart Money". BubbleXRay oznacza skoki wysokiego wolumenu proporcjonalnymi bąbelkami bezpośrednio na cenie. Wyświetla skumulowaną zmianę wolumenu (CVD) zintegrowaną w jednym wskaźniku, bez przeciążania lub zaśmiecania wykresu. Koniec z wątpliwościami: zobacz ślady instytucjonalne w momencie ich wystąpienia.
✅ DLACZEGO UŻYWAĆ BUBBLEXRAY?
- Natychmiastowe Skoki Aktywności: Bąbelki pojawiają się zaraz po zamknięciu słupka o wysokim wolumenie.
- Ślady Instytucjonalne: Duże bąbelki na kluczowych poziomach pokazują aktywność dużych graczy.
- Inteligencja CVD: Zintegrowana skumulowana delta wolumenu pokazuje, czy presja była kupna czy sprzedaży.
- Auto-Dostosowanie: System percentylowy dostosowuje się do każdego rynku (trend lub konsolidacja).
- Zakotwiczenie do Ceny: Wolumen jest wyświetlany na dokładnym poziomie ceny, nie ukryty w histogramach pod wykresem.
📺 OBEJRZYJ SAMOUCZEK I ZADAJ PYTANIA:
(Prosimy o zamieszczanie pytań i próśb o wsparcie w komentarzach pod powyższym filmem, aby pomóc jak największej liczbie osób!)
🛠️ CECHY TECHNICZNE:
- Proporcjonalny Rozmiar: Promień bąbelka skaluje się zgodnie z wielkością wolumenu.
- Podwójne Potwierdzenie: Użyj pierścienia radialnego i wewnętrznej strzałki dla głębszego kontekstu CVD.
- Brak Konfiguracji: Automatycznie wybiera najlepszy interwał czasowy danych dla Twojego wykresu.
- Czysty Interfejs: Konfigurowalna przezroczystość i limity wyświetlania, aby utrzymać profesjonalny wygląd wykresu.
Podsumowanie
Opinie klientów
5 | 0 % | |
4 | 100 % | |
3 | 0 % | |
2 | 0 % | |
1 | 0 % |