
Descrição
Cansado de indicadores atrasados e sinais falsos? Descubra a fusão definitiva da teoria do ponto pivô com o momentum SuperTrend que oferece pontos de entrada e saída com precisão profissional e precisão de laser.
🌟 O QUE TORNA ESTE INDICADOR ESPECIAL?
Tecnologia de Duplo Poder
- Precisão do Ponto Pivô: Identifica níveis-chave de suporte/resistência usando detecção sofisticada de ponto pivô
- Momentum SuperTrend: Combina volatilidade ATR com precisão de seguimento de tendência
- Confirmação Inteligente de Sinal: Elimina sinais falsos com validação de tendência incorporada
Recursos Profissionais
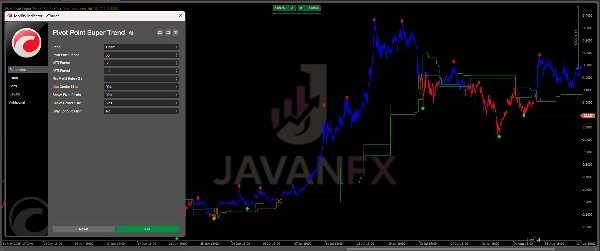
- 🎯 Sinais Visuais de Tendência: Linhas codificadas por cores claras (Verde = Alta, Vermelho = Baixa)
- ⚡ Alertas em Tempo Real: Notificações instantâneas na área de trabalho para oportunidades de entrada
- 📊 Pontos Pivô Dinâmicos: Detecta automaticamente pontos de reversão significativos do mercado
- 🎚️ Totalmente Personalizável: Ajuste a sensibilidade para combinar com qualquer estilo de negociação ou período de tempo
📈 PERFEITO PARA TODOS OS MERCADOS E PRAZOS
Day Traders: Capture tendências intradiárias com entradas precisas
Swing Traders: Aproveite grandes tendências com confiança
Traders de Forex e Cripto: Funciona excepcionalmente bem em mercados voláteis
Traders de Ações e Futuros: Confiável em todos os instrumentos líquidos
🎯 COMO USAR (Simples e Poderoso)
Configuração Básica:
- Aplique o indicador no seu gráfico (de 1min a semanal)
- Linha Verde: Preço acima = sinal de COMPRA 📈
- Linha Vermelha: Preço abaixo = sinal de VENDA 📉
Sinais de Entrada:
- COMPRA quando a linha fica VERDE e o preço fecha acima
- VENDA quando a linha fica VERMELHA e o preço fecha abaixo
- Confirmação: Aguarde o alinhamento do ponto pivô para maior precisão
Estratégia de Saída:
- Stop Loss: Abaixo/acima da linha SuperTrend
- Take Profit: Quando a linha de tendência muda de cor ou em níveis pivô chave
Recursos Avançados:
- Linha Central: Use como suporte/resistência dinâmico para realização parcial de lucros
- Pontos Pivô: Níveis principais atuam como confirmação para entradas/saídas
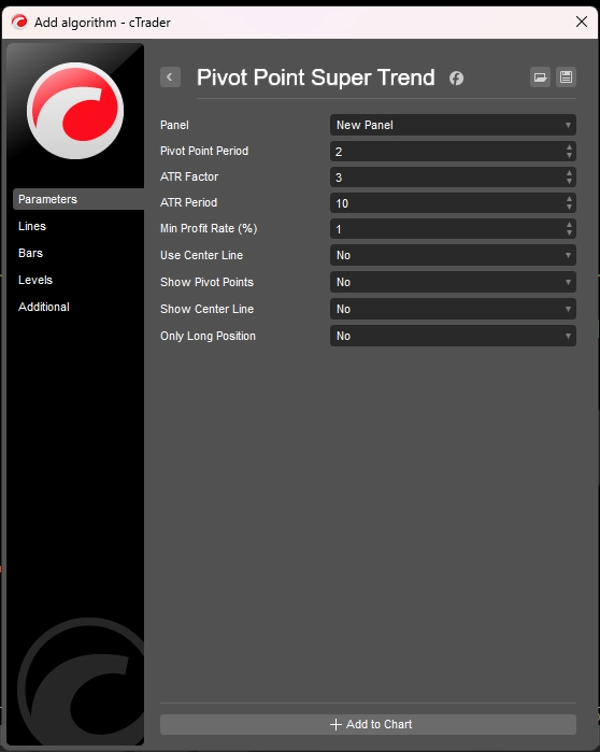
⚙️ CONFIGURAÇÕES OTIMAS
Day Trading (1min - 15min):
- Período do Pivô: 2-3
- Fator ATR: 2.5-3.5
- Período ATR: 10-15
Swing Trading (1H - Diário):
- Período do Pivô: 3-5
- Fator ATR: 3-4
- Período ATR: 14-20
Position Trading (Semanal):
- Período do Pivô: 5-7
- Fator ATR: 4-5
- Período ATR: 20-25
💡 DICAS PROFISSIONAIS
- Combine com suporte/resistência principais para resultados explosivos
- Use em múltiplos prazos para confluência (ex.: tendência 1H + entrada 15min)
- Ajuste o Fator ATR com base na volatilidade do mercado
- Teste diferentes configurações para seu instrumento específico
Resumo
Key functionalities include color-coded trend lines—green for bullish and red for bearish trends—real-time desktop alerts for trade opportunities, and dynamic pivot points that automatically detect significant market turning points. It is fully customizable, allowing traders to adjust sensitivity settings to suit various trading styles and timeframes.
This indicator supports all markets and timeframes, making it suitable for day traders, swing traders, forex, crypto, stock, and futures traders. Typical usage involves applying the indicator to charts from 1-minute to weekly intervals, interpreting green lines and price above as buy signals, and red lines with price below as sell signals, with pivot point alignment for confirmation. Exit strategies include setting stop losses relative to the SuperTrend line and taking profits at trend changes or pivot levels.
Optimal settings vary by trading style, with specific pivot periods, ATR factors, and ATR periods recommended for day trading, swing trading, and position trading. Additional features include a center line for dynamic support/resistance and partial profit-taking.
Avaliações de clientes
5 | 100 % | |
4 | 0 % | |
3 | 0 % | |
2 | 0 % | |
1 | 0 % |


