
Trend Direction Force Index - TDFI (Alerts)
インジケーター
2 購入済
バージョン 1.0、Aug 2025
Windows、Mac
4.7
レビュー: 4
説明
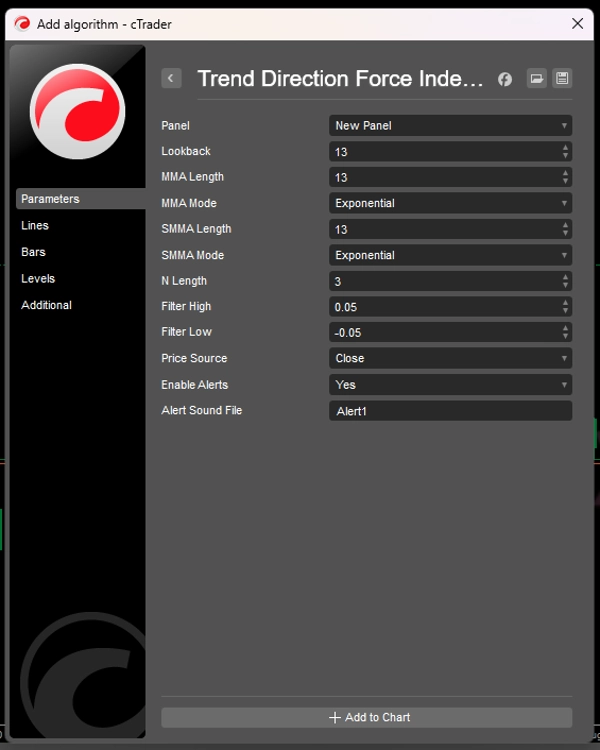
トレンド方向力指数(TDFI) は、トレーダーが強いトレンドの動きと潜在的な反転を正確に識別するのを支援するために設計された強力なモメンタムベースの指標です。2つの移動平均とその変化率の関係を分析することで、TDFIは市場のノイズを除去し、高確率の取引機会を強調します。
主な特徴:
✅ 明確なトレンド識別 – カスタマイズ可能な閾値に基づき、強気(緑)と弱気(赤)のモメンタムを視覚的に区別します。
✅ 適応的スムージング – 最適な応答性のために複数の移動平均タイプ(EMA、WMA、Hull、TEMAなど)を使用します。
✅ ノイズ低減 – 動的正規化により、重要な価格変動のみがシグナルを発生させます。
✅ カスタマイズ可能なアラート – トレンドが強まるか反転するとリアルタイム通知を受け取れます。
✅ すべての時間枠で機能 – スキャルピング、デイトレード、スイングトレードに効果的です。
TDFIの仕組み
TDFIは、2つの特別に調整された移動平均間の ダイバージェンス と モメンタム を分析してトレンドの強さを測定します:
- MMA(メイン移動平均) – 短期の価格モメンタムを追跡します
- SMMA(スムーズ移動平均) – 基本的なトレンドを識別します
その後、指標は以下を計算します:
🔹 ダイバージェンスフォース – MMA間の距離(トレンドの強さ)
🔹 モメンタム加速 – トレンドの動きの速さ
🔹 正規化出力 – 極端な値を避けるためにシグナルをスケーリング
これらの力が組み合わさると:
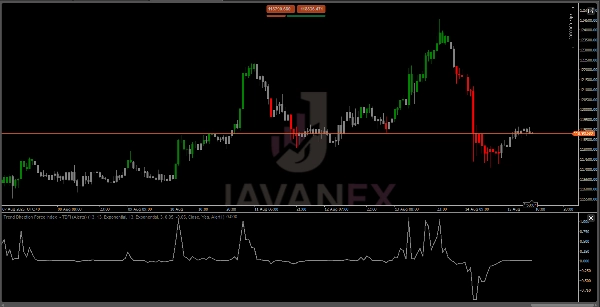
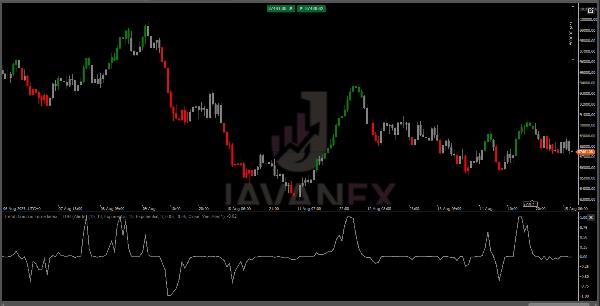
- TDFI > 上限閾値(緑) = 強い強気モメンタム
- TDFI < 下限閾値(赤) = 強い弱気モメンタム
- 閾値間(灰色) = 中立/統合
概要
AIによる概要
The Trend Direction Force Index (TDFI) is a momentum-based trading indicator designed to identify strong trend movements and potential reversals by analyzing the relationship and rate of change between two moving averages: a Main Moving Average (MMA) for short-term momentum and a Smoothed Moving Average (SMMA) for the underlying trend. TDFI calculates divergence force (distance between MMAs), momentum acceleration (trend speed), and normalizes these values to filter out market noise. The indicator visually distinguishes bullish momentum (green), bearish momentum (red), and neutral/consolidation phases (gray) based on customizable thresholds. It supports adaptive smoothing using various moving average types such as EMA, WMA, Hull, and TEMA for responsiveness. TDFI includes customizable real-time alerts for trend strength changes and reversals and is applicable across all timeframes, making it suitable for scalping, day trading, and swing trading.
インジケーターのプロフィール
カスタマーレビュー
4.7
レビュー: 4
5 | 75 % | |
4 | 25 % | |
3 | 0 % | |
2 | 0 % | |
1 | 0 % |
カスタマーレビュー
October 10, 2025
Clean and powerful! ⚡ TDFI nails trend strength and timing — great for spotting impulses and avoiding fakeouts. Simple, smooth, and rock solid!
August 30, 2025
the useful bit is direction is easier to respect, and the trade still needs a calm entry.
August 24, 2025
August 21, 2025
ディスカッション
よくあるご質問
cTrader Storeで入手可能な取引ボット、インジケーター、プラグインなどの商品は、第三者の開発者が提供するものであり、情報と技術の取得のみを目的としてご利用いただけます。cTrader Storeはブローカーではなく、投資助言や個人的な推奨を行うことも、将来のパフォーマンスを保証することもありません。


価格
登録日 14/07/2025
60
販売