
说明
介绍 Stochastic RSI PRO 适用于 cTrader,是 Stochastic RSI 指标的高级且高度可定制版本,旨在提升您的交易精准度。
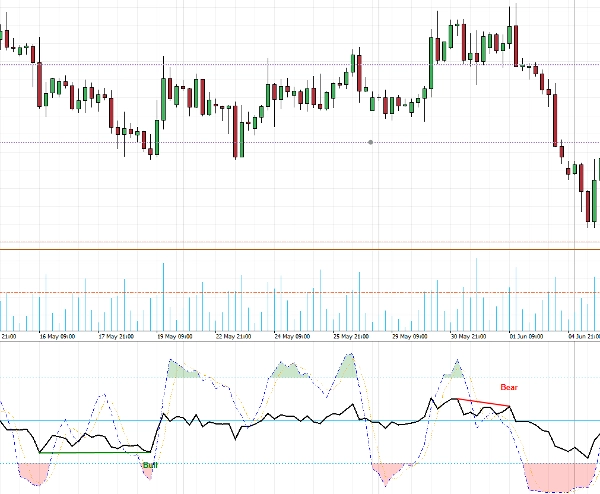
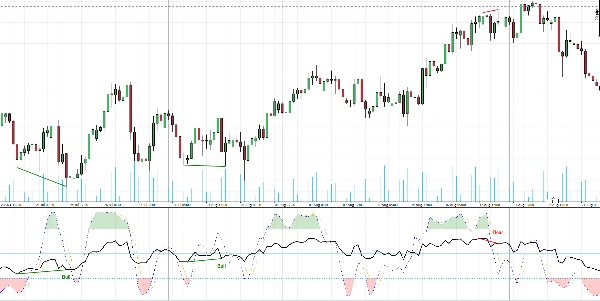
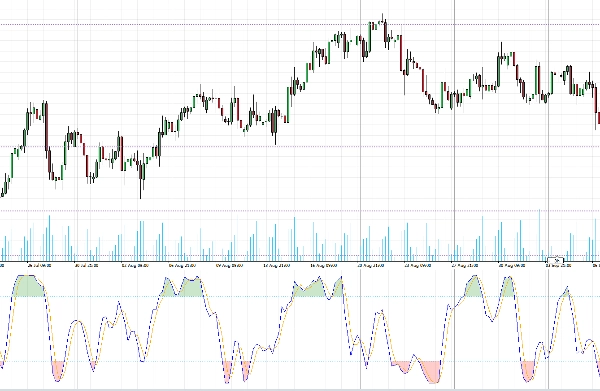
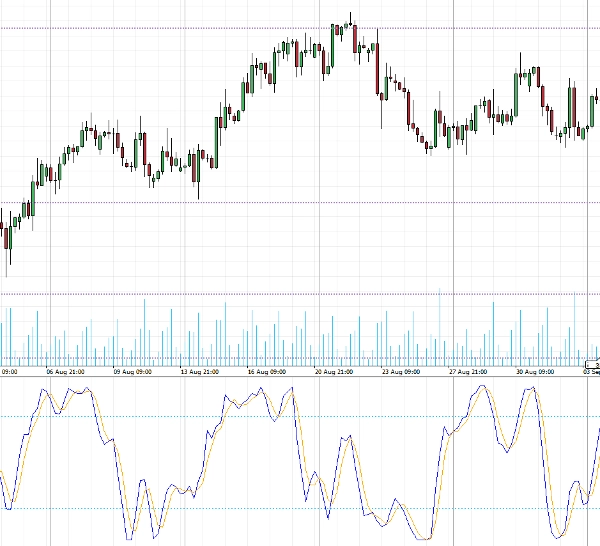
这个强大的工具将 RSI 直接叠加在 Stochastic RSI 上,提供市场动量的全面视图。它通过不同的颜色突出显示超买和超卖区域,便于识别。
Stochastic RSI PRO 的突出特点是能够识别并可选择性地高亮显示图表上的常规和隐藏 背离。您可以从三种方法中选择识别背离: Swing、Pivot 或 Linear Fit,每种方法都具有可定制的设置以匹配您的交易策略。
使用 Stochastic RSI PRO 提升您的分析和决策能力,这是精明交易者必备的工具。
摘要
AI 摘要
Stochastic RSI PRO is an advanced indicator for the cTrader platform that overlays the Relative Strength Index (RSI) onto the Stochastic RSI to provide a detailed view of market momentum. It visually highlights overbought and oversold zones with customizable color coding for easier interpretation. The indicator features the ability to detect and optionally highlight both regular and hidden divergences on price charts. Users can select from three divergence detection methods—Swing, Pivot, or Linear Fit—each offering customizable settings to align with individual trading strategies. This tool supports analysis across multiple markets including Forex, cryptocurrencies, commodities, indices, and stocks, with specific symbol tags such as BTCUSD, EURUSD, GBPUSD, XAUUSD, NAS100, and USDJPY. Stochastic RSI PRO is designed to enhance precision in trade analysis by combining momentum indicators and divergence signals in a single, customizable interface.
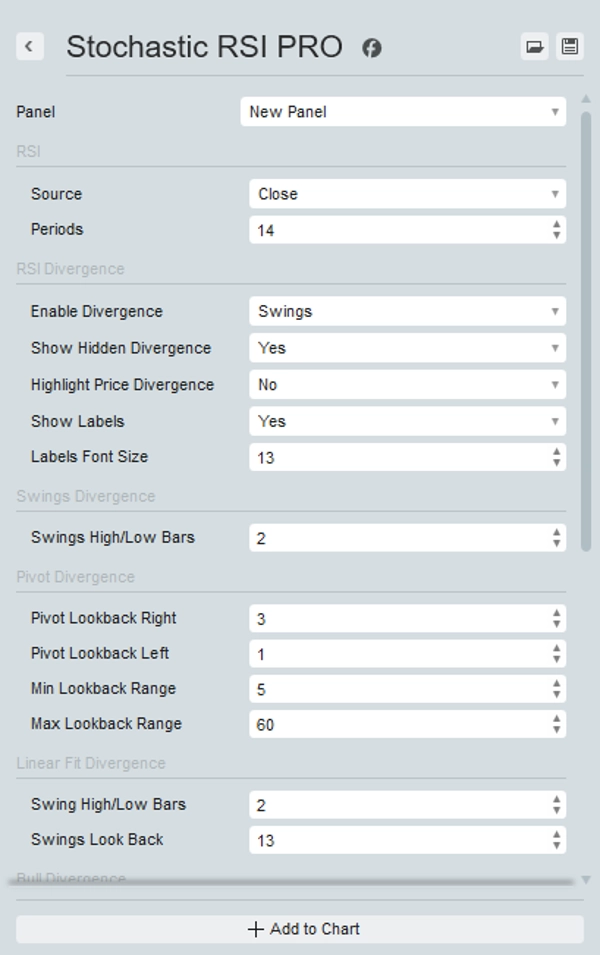
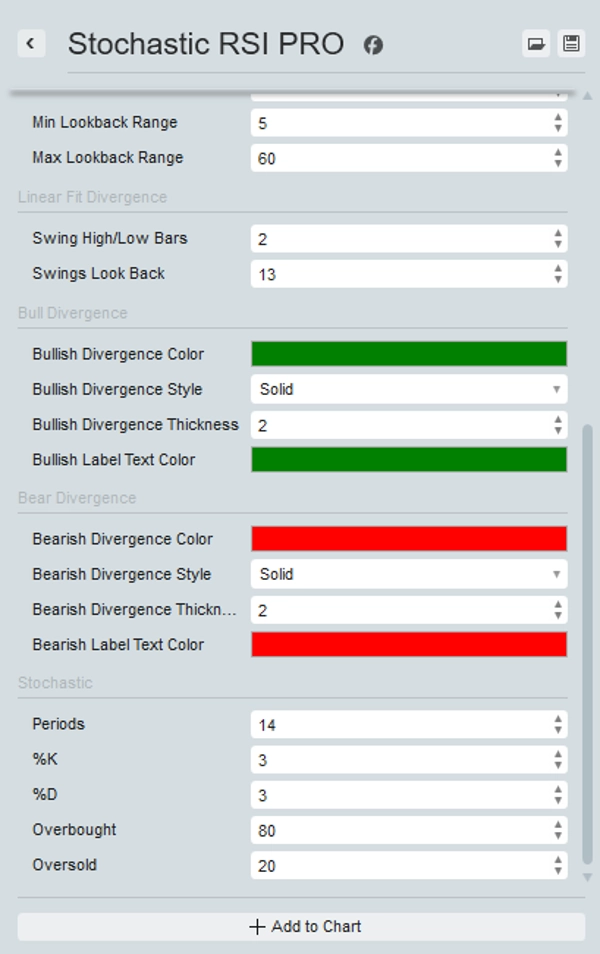
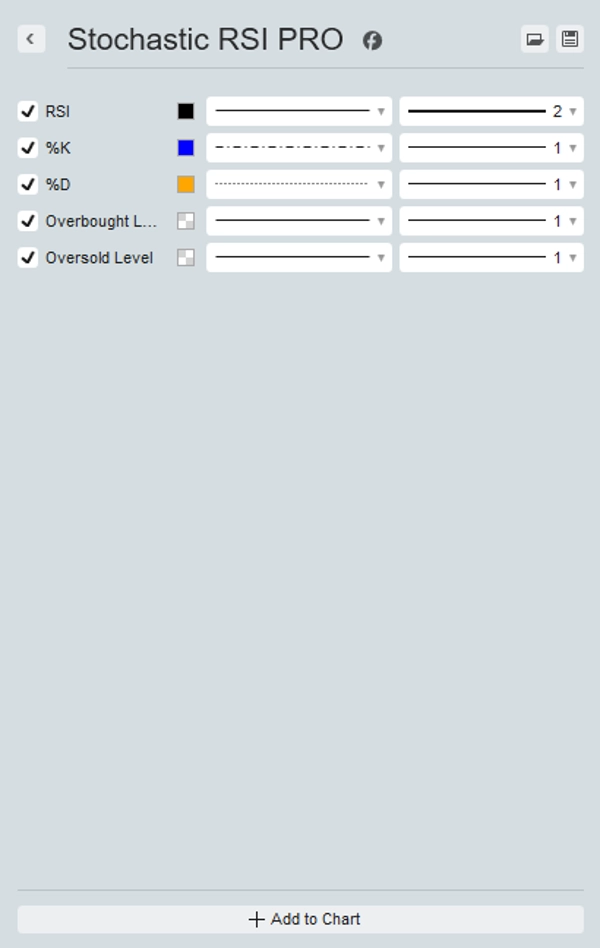
指标配置
客户评价
4.7
评价:4
5 | 75 % | |
4 | 25 % | |
3 | 0 % | |
2 | 0 % | |
1 | 0 % |
客户评价
February 25, 2026
Stochastic RSI PRO adds serious depth to the classic StochRSI by overlaying RSI and offering three divergence detection modes (Swing, Pivot, Linear Fit). Signals are clean on M5-H4, with the best structure on H1 and above. Flexible, customizable and practical for momentum and divergence-based strategies. A solid upgrade over standard StochRSI.
November 25, 2025
November 17, 2025
the part worth keeping is the trade idea gets a short cooling period. It should not be treated as the full answer.
November 13, 2025
What stood out was the opening read should not drive the only input, and It needs a boring test before bigger size.
讨论
常见问答
BTCUSD
Forex
Signal
Indices
EURUSD
Commodities
GBPUSD
NZDUSD
RSI
Prop
Scalping
Crypto
Stocks
XAUUSD
NAS100
USDJPY
cTrader Store 提供的所有产品,包括交易机器人、指标和插件,均由第三方开发者提供,仅供信息参考和技术访问之用。cTrader Store 并非经纪商,不提供投资建议、个人推荐或任何未来业绩保证。


!["[Hamster-Coder] Bollinger Bands" 标识](https://cdn.ctrader.com/image/webp/21d8e5d6-fb11-4bac-b9ee-cd05c2b76804_30327)


价格
注册日期 25/09/2025
25
销售
331
免费安装