present
سجل واحصل على خصم 50 دولارًا على مشترياتك الأولى
Trading product for Previous Day Low High مؤشر BTCUSD Forex, image 1
Previous Day Low High
مؤشر
3 عمليات الشراء
الإصدار 1.3، Feb 2026
Windows, Mac
5.0
التقييمات: 2
Trading product for Previous Day Low High مؤشر BTCUSD Forex, image 2
Trading product for Previous Day Low High مؤشر BTCUSD Forex, image 3
Trading product for Previous Day Low High مؤشر BTCUSD Forex, image 4
Trading product for Previous Day Low High مؤشر BTCUSD Forex, image 5
منذ 26/09/2025
18
المبيعات

الوصف

أعلى / أدنى اليوم السابق – مستويات فيرجن النهائية

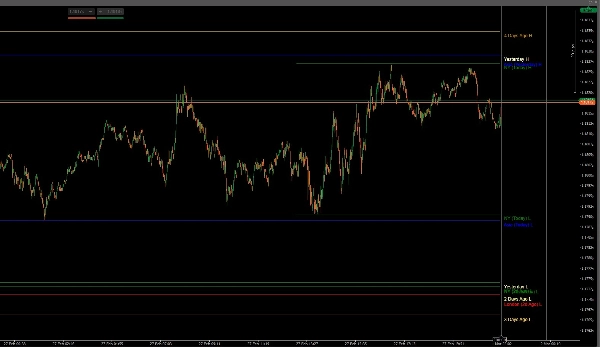
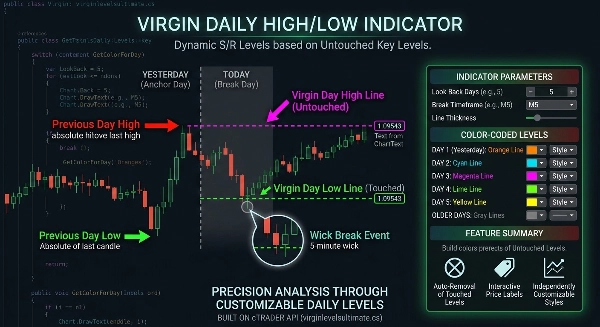
مستويات فيرجن النهائية هي مؤشر تتبع دقيق للمستويات يقوم تلقائيًا برسم أعلى وأدنى النقاط غير المستخدمة من أيام التداول السابقة ويحتفظ بها على الرسم البياني الخاص بك حتى يكسر السعر هذه المستويات.

مصمم للمتداولين الذين يفهمون أن مستويات السيولة غير الملموسة تعمل كمغناطيس للسعر، يوفر لك هذا الأداة إطارًا نظيفًا ومنظمًا لتنفيذ الاختراقات والانعكاسات.

تم توسيعه الآن مع أعلى / أدنى جلسات آسيا ولندن ونيويورك، بالإضافة إلى المستويات الأسبوعية والشهرية السابقة، مما يخلق خريطة سيولة متعددة الأطر الزمنية كاملة.

مصمم للفوركس والمؤشرات والذهب والعملات المشفرة — عبر جميع الأطر الزمنية.
تداول السيولة الرئيسية. تداول بدقة.


⚙ المحرك الأساسي

  • الكشف التلقائي عن أعلى وأدنى اليوم السابق
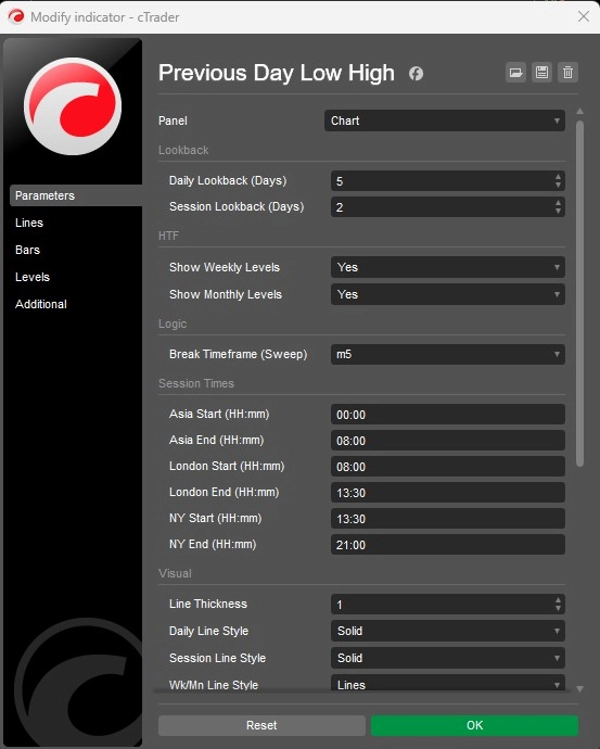
  • فترة النظر للخلف اليومية القابلة للتخصيص (تتبع عدة أيام ماضية)
  • الكشف عن أعلى/أدنى جلسات آسيا ولندن ونيويورك
  • التحكم في النظر للخلف للجلسة (تتبع عدة جلسات سابقة)
  • أعلى / أدنى أسبوعي سابق (اختياري)
  • أعلى / أدنى شهري سابق (اختياري)
  • تفعيل المستويات فقط من فترة التداول الصالحة التالية
  • الإزالة التلقائية بمجرد لمس المستوى (بدون ازدحام)
  • الكشف عن الاختراق بناءً على إطار زمني أدنى قابل للاختيار
  • التحقق من المستوى في الوقت الحقيقي


📊 منطق مستوى فيرجن

  • يرسم فقط أعلى وأدنى النقاط غير المستخدمة (فيرجن)
  • فصل واضح للمستويات اليومية والجلسات والأسبوعية والشهرية
  • تتبع متعدد الأيام (اليوم 1 إلى اليوم 5+)
  • تتبع الجلسات (اليوم، الأمس، النظر للخلف المخصص)
  • تمييز بصري للأيام الأقدم
  • رسم دعم ومقاومة ديناميكي
  • إطار عمل للاختراق قائم على السيولة
  • هيكل تلاقي متعدد الأطر الزمنية


🕒 الكشف الذكي عن الاختراق

  • إطار زمني للاختراق قابل للاختيار (مثلاً M5، M15، إلخ)
  • دقة داخل اليوم لإبطال المستوى
  • مسح أعلى/أدنى من وقت التفعيل الصالح
  • يعمل عبر المستويات اليومية والجلسات والأسبوعية والشهرية
  • يتوقف عن الرسم فورًا بعد تأكيد اللمس
  • منطق رسم بياني نظيف — بدون رسم زائد تاريخي


🎨 التخصيص الكامل

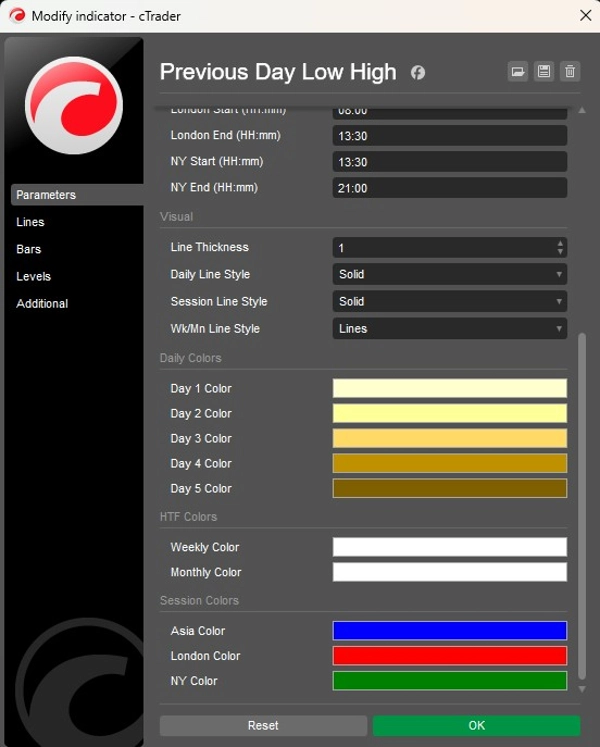
  • تحكم لوني مستقل لكل فترة نظر للخلف يومية
  • ألوان مخصصة لجلسات آسيا ولندن ونيويورك
  • ألوان منفصلة للمستويات الأسبوعية والشهرية
  • أنماط خطوط قابلة للتعديل (يومي / جلسة / إطار زمني أعلى)
  • إعدادات سمك مخصصة
  • تسميات أسعار تلقائية مع تكديس ذكي (بدون تداخل)
  • مظهر رسم بياني بسيط واحترافي


🎯 مثالي لـ

  • متداولي مسح السيولة
  • متداولي الاختراق والاختراقات الزائفة
  • متداولي أسلوب SMC / ICT
  • المتداولين المعتمدين على الجلسات (آسيا، لندن، نيويورك)
  • المتداولين داخل اليوم والمتأرجحين
  • أنظمة قواعد شركات التداول
  • متداولي الأصول المتعددة (الفوركس، المؤشرات، المعادن، العملات المشفرة)


الملخص

ملخص الذكاء الاصطناعي
Previous Day Low High is an indicator designed to automatically identify and plot untouched (virgin) high and low price levels from previous trading days, sessions, weeks, and months. It supports multi-timeframe liquidity mapping by tracking Asia, London, and New York session highs and lows, as well as previous weekly and monthly levels. The indicator maintains these levels on the chart until price breaks them, with break detection based on a selectable lower timeframe for intraday precision.

Key features include automatic detection and plotting of prior highs and lows, customizable lookback periods for days and sessions, real-time validation, and automatic removal of levels once touched to reduce chart clutter. It visually distinguishes older levels and separates daily, session, weekly, and monthly levels with independent color and style customization. The tool supports dynamic support and resistance mapping and provides a liquidity-based breakout framework suitable for Forex, indices, gold, cryptocurrencies, and other markets.

This indicator is suitable for liquidity sweep traders, breakout and fakeout strategies, smart money concept (SMC) and institutional trading (ICT) styles, session-based trading, intraday and swing trading, prop firm rule-based systems, and multi-asset trading. It offers a professional, minimal chart appearance with auto price labels and smart stacking.
ملف تعريف المؤشر

مناقشة

تقييمات العملاء

5.0
التقييمات: 2
5
100 %
4
0 %
3
0 %
2
0 %
1
0 %
تقييمات العملاء
March 13, 2026
March 2, 2026

الأسئلة الشائعة

BTCUSD
Forex
Breakout
Indices
EURUSD
Commodities
GBPUSD
NZDUSD
Prop
SMC
Crypto
Stocks
XAUUSD
NAS100
USDJPY
يتم توفير المنتجات المتاحة من خلال cTrader Store، بما في ذلك روبوتات التداول والمؤشرات والإضافات، من قبل مطوري الطرف الثالث وإتاحتها لأغراض الوصول المعلوماتي والفني فقط. cTrader Store ليس وسيطًا ولا يقدم نصائح استثمارية أو توصيات شخصية أو أي ضمان للأداء المستقبلي.

المزيد من هذا المؤلف
cBot
Prop
Forex
+14
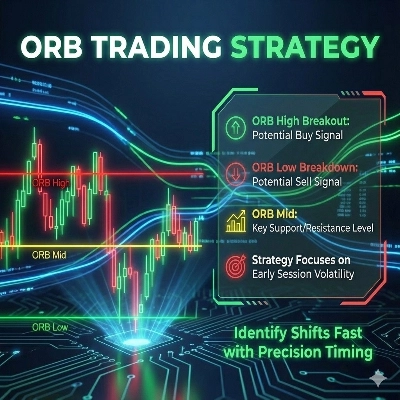
Automated ORB bot: Stop/Limit entries, EMA/PDH filters, auto-BE, and session trade limits.
مؤشر
SMC
VWAP
+16
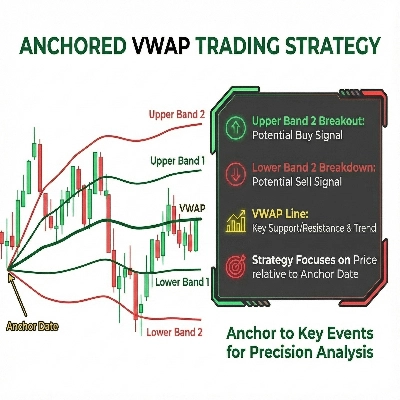
It calculates Anchored VWAP and StdDev bands from a user-defined start date for cTrader charts.
مؤشر
SMC
Forex
+15
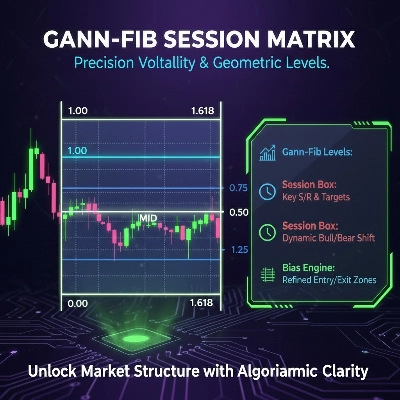
Session-based range tool projecting adaptive Gann & Fib levels with auto bias flip and extensions.
مؤشر
SMC
Prop
+15
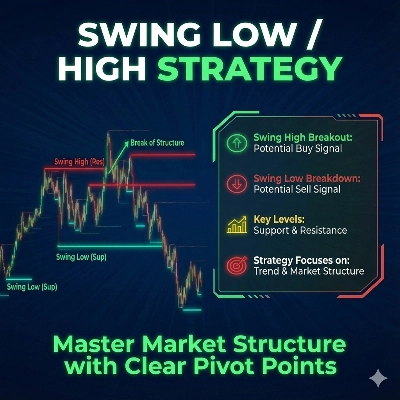
Auto-detects Swing Highs/Lows to draw dynamic Support & Resistance levels with break tracking.
مؤشر
Key Levels
Support & Resistance
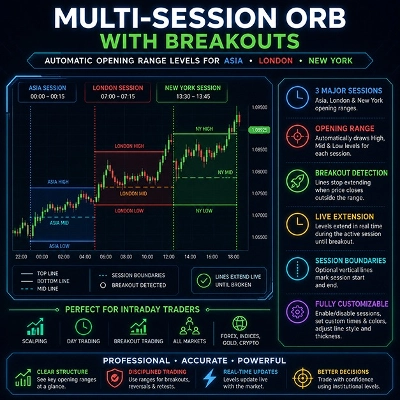
Professional Opening Range Breakout indicator with live ORB levels and breakout detection.
مؤشر
SMC
Forex
+10
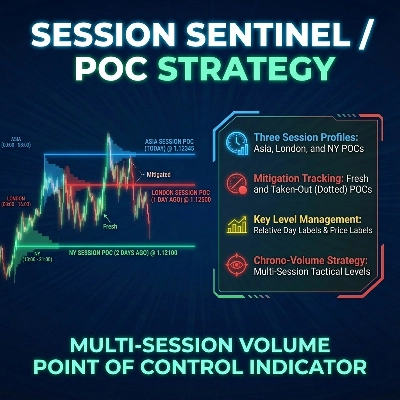
Session POC levels for Asia, London & NY with mitigation tracking for precise liquidity-based trading.
مؤشر
EMA
SMA
+3
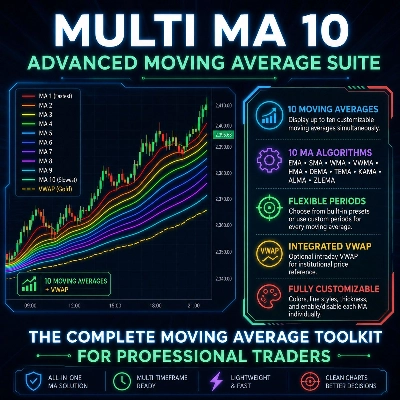
Display up to 10 customizable moving averages and optional VWAP in one powerful indicator.
مؤشر
CHOCH
Fair Value Gap
+2
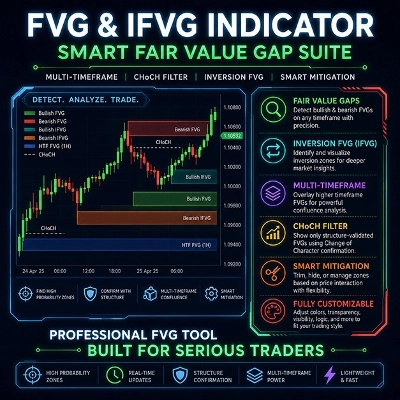
Advanced FVG & IFVG indicator with multi-timeframe confluence, CHoCH filtering, and smart mitigation.

قد يعجبك أيضًا

مؤشر
SMC
Signal
+2
Gold Market Maker Zones; Non-repainting Supply & Demand detector for XAUUSD. Precise institutional zones for cTrader.
مؤشر
Volume
Support & Resistance
Compare up to 27 symbols across eight timeframes with seven analysis engines and an interactive cTrader dashboard.
مؤشر
Prop
Forex
+4
This is an indicator that can alert you about trendlines, horizontal lines and vertical lines.
مؤشر
Prop
Forex
+12
Half Trend Cloud
مؤشر
RSI
VWAP
+5
Trend direction, chart signals, reversal zones and volume tools in one configurable indicator.
مؤشر
EMA
Supertrend
+4
Dynamic dual MA cloud indicator. Identifies trends, crossovers, and pullback entries in real time for any asset.
مؤشر
SMC
Forex
+15
Session-based range tool projecting adaptive Gann & Fib levels with auto bias flip and extensions.
مؤشر
ATR
BOS
+5
Market structure with BOS and CHoCH, order blocks, and retest buy/sell arrows with entry, stop and two targets
مؤشر
Prop
Forex
+13
"Footprint Chart: Visualize bid-ask volume inside candles for clearer order flow and market depth insights."
مؤشر
Prop
Forex
+11
⚡Nebula Range Filter is a professional trend filter indicator for cTrader⚡
شعار "VegaXLR - Fibonacci Bands"
الأعلى تقييمًا
4.5
(4)
$20
/
$29
مؤشر
Forex
Customizable Dynamic Fibonacci Channels and Smart Alerts
مؤشر
SMA
Volume
+3
Stoc​h PRO Quad Rotation Signal (QRS) is an advanced technical analysis indicator developed for cTrader.
مؤشر
SMC
Prop
+7
institutional-level market analysis
مؤشر
RSI
Breakout
+1
🚀 TrendHeikinMultiMA: Advanced trend detection using Heikin-Ashi smoothing & MAs! Eliminates noise, confirms real trend
مؤشر
Imbalance
Fair Value Gap
+4
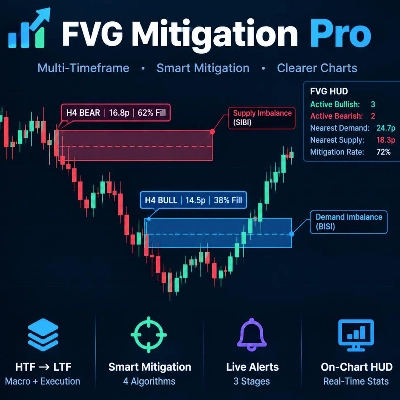
Fair Value Gap scanner with live fill telemetry, 50% CE lines, 4 mitigation rules, and a 3-stage native alert system.
مؤشر
SMC
Forex
+5
The only cTrader FVG indicator with Breakaway Gap detection, mitigation tracking, and full multi-asset compatibility.
مؤشر
Pin Bar
Inside Bar
+2
Advanced candlestick pattern recognition with structural quality scoring, alerts and adaptive chart visuals.
مؤشر
Volume
Key Levels
View tick activity across a selected chart range with Point of Control, Value Area High and Value Area Low.

السعر

منذ 26/09/2025
18
المبيعات