
新手交易者犯的最大错误之一是试图通过添加过多指标来向图表中创建尽可能多的信息,结果是图表充满了噪音,线条和数据产生各种无意义的信息,给交易者带来矛盾的解读。
优点:
- 在检测反转方面具有惊人的准确性。
- 视觉上令人愉悦,易于观察市场状况。
- 可用作趋势交易指标或反趋势交易指标。
- 强大的回测结果(极端信号约95%的准确率)。
缺点:
- 即使在超买“极端”和超卖“极端”条件下,该指标有时也可能导致你在非常强劲趋势的反方向交易,导致在价格最终反转之前出现较大回撤。
- 在15分钟及以上时间框架交易时,超买“极端”和超卖“极端”信号可能很少。为此,建议至少交易8个主要货币对以频繁接收极端信号。
如何使用Chaos反转
使用Chaos可以创建一个简单且成功的系统,通过标记每周和每日的支撑与阻力线,并利用15分钟Chaos的超买极端和超卖极端信号进行反趋势交易,捕捉接近这些支撑和阻力线的反弹。
信号生成方式如下:
- 快速W%R先移动,随后是慢速W%R。
- 当单一快速W%R处于超卖或超买状态时,可以利用这些反转进行短线交易。
- 当快速和慢速W%R均处于超卖或超买状态时,表明市场将发生显著反转。
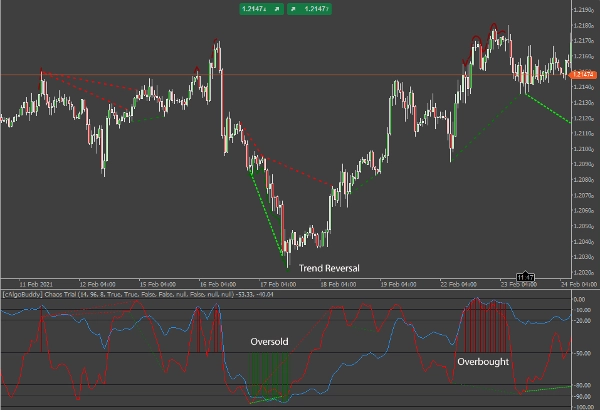
该指标将在价格图表的低点或高点绘制红色或绿色线条,并在指标区域绘制红色或绿色线条以标记极端超卖或超买状态。你可以在指标选项中禁用此功能。
识别背离
由于W%R是一个振荡器,它为我们提供了识别和交易背离的机会。背离主要有两种类型:常规和隐藏。
- 常规背离表示价格方向的反转。
- 隐藏背离表示价格方向的延续。
在每种主要类型中,还有次级分类:看跌(负面)和看涨(正面)。
- 当指标下移而价格上涨或持平时,发生看跌背离。
- 当指标上移而价格下跌或持平时,发生看涨背离。
常规背离
简单来说,常规背离是指:
- 价格创出更高高点,而快速W%R线创出更低高点:潜在做空信号。
- 价格创出更低低点,而快速W%R线创出更高低点:潜在做多信号。
无论哪种情况,交易者都在寻找价格走势的潜在反转。
常规背离最好用于比较当前的摆动高点或低点与之前的摆动高点或低点。通过常规背离,趋势正在减弱,市场情绪已转向相反方向。交易者可以准备交易有利的反转或回调。
在Chaos反转中,常规背离显示如下:
- 看涨常规背离 – 明亮绿色窄虚线。
- 看跌常规背离 – 红色窄虚线。
注意:背离线出现在确认背离后的下一根K线开盘时。
隐藏背离
简单来说,隐藏背离是指:
- 快速W%R线创出更低低点,而价格创出更高低点:潜在做多信号。
- 快速W%R线创出更高高点,而价格创出更低高点:潜在做空信号。
无论哪种情况,交易者都在寻找价格走势的潜在延续。
隐藏背离最好用于评估与当前趋势相关的价格。回调后,价格通常会沿趋势方向继续,朝向上一个摆动高点或低点的水平。隐藏背离表明趋势可能正在减弱,但尚未完成。如下面所示,市场可能因获利了结而回调,随后看似将恢复下跌趋势。
在Chaos反转中,隐藏背离显示如下:
- 看跌隐藏背离 – 绿色宽虚线。
- 看涨隐藏背离 – 深红色宽虚线。
使用背离交易
在使用背离交易时需要注意的是,市场可能不会按照背离信号的方向移动。重要的是要理解背离只是市场方向潜在的变化或延续的指示。需要监控价格走势以确认市场方向。同时,通过将指标线与水平线(0表示极端超买,-100表示极端超卖)进行比较,注意Chaos指标的整体方向。
提醒与通知
将发送的信号包括极端超买/超卖的开始和结束,慢速W%R在极端位置的峰值以及所有背离。
Telegram提醒
假如你已经在Telegram中设置了机器人和频道,Chaos反转指标将向你发送货币对确认信号的消息。
重要:
请确保你的时区已正确调整为本地时间(应用程序右下角)。
桌面提醒
如果选择“是”,Chaos反转指标将在确认信号时向你的个人桌面推送消息框通知。
邮件提醒
要使用此功能,必须先配置你的cTrader以能够发送邮件(设置-> 邮件)。
5 | 100 % | |
4 | 0 % | |
3 | 0 % | |
2 | 0 % | |
1 | 0 % |


!["[Stellar Strategies] Inside Bar with Signals" 标识](https://cdn.ctrader.com/image/webp/1d9e8bfa-3b2c-4440-bb37-5856902008a7_30683)


