
Beschreibung
Wenn sich der Markt weiterhin in diese neue Richtung bewegt, wird irgendwann der Gewinn aus dem Handel in die entgegengesetzte Richtung den Verlust aus dem ursprünglichen Handel übersteigen, woraufhin Sie beide Trades schließen können.
Wenn der Markt zur vorherigen Richtung zurückkehrt, wird der gegensätzliche Trade mit der größeren Lotgröße Verluste schneller ansammeln, als der ursprüngliche Trade Gewinne erzielt. In dieser Situation eröffnen wir einen weiteren Trade in der ursprünglichen Richtung, wodurch der ursprüngliche Trade und der dritte Trade zusammen größer sind als der zweite Trade.
Diese Hin- und Her-Hedging-Strategie kann fortgesetzt werden, bis die Kursbewegung in eine der beiden Richtungen ausbricht.
Wie man den Zone Recovery Indikator verwendet
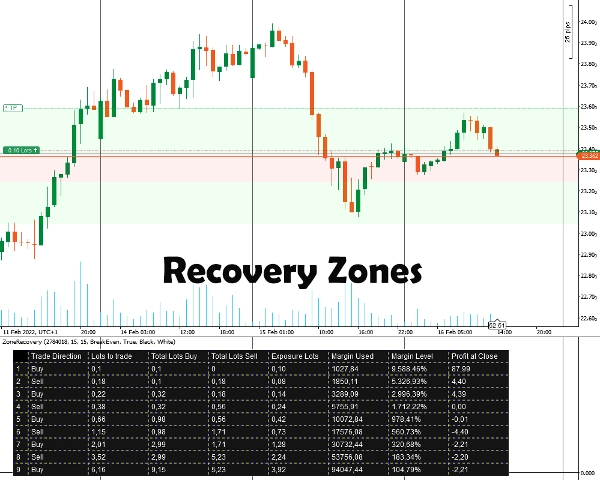
Zuerst müssen Sie die Positions-ID eingeben, für die Sie hedgen möchten. Die Position muss ein Gewinnziel haben. Danach wählen Sie die Zone Recovery Größe, indem Sie die Anzahl der Pips eingeben, bei der Sie Ihrer Meinung nach mit dem Hedging beginnen müssen. Der Indikator zeigt die Zonen sowie die Tabelle an, damit die Strategie funktioniert.
Sie müssen alle nachfolgenden Positionen manuell mit Orders, Stop-Loss- und Take-Profit-Zielen platzieren.
Wichtige Informationen
Zuallererst muss Ihr Handelskonto ein Hedging-Konto sein.
- Im Kern handelt es sich um eine Martingale-Strategie, die mit Risiken verbunden ist. Wenn der ursprüngliche Trade in einem Seitwärtsmarkt eröffnet wird, kann dies schnell Ihre Margin aufbrauchen. Sie benötigen volatile/trendstarke Instrumente für bessere Ergebnisse.
- Handelsinstrumente mit niedrigen Kommissionen/kleinen Spreads funktionieren besser.
- Wenn der ursprüngliche Trade mit der minimalen Lotgröße durchgeführt wird, sind die nachfolgenden Berechnungen aufgrund falscher Kommissionsberechnungen und auf- oder abgerundeter Lotgrößen für zukünftige Trades geringfügig ungenau.
- Wenn Sie ein Instrument handeln, das sich von der Währung Ihres Kontos unterscheidet, wird die Margin-Berechnung aufgrund ständig wechselnder Wechselkurse leicht abweichen. (Zum Beispiel Konto in EUR, offene Position in GBP/USD)
- Swaps werden nicht berücksichtigt.
Indikatoroptionen
Der Indikator bietet die folgenden Optionen:
- Positions-ID - Die offene Positions-ID, für die Sie die Hedging-Tabelle berechnen möchten. Sie kann ohne das anfängliche „PID“ eingegeben werden (nur die Zahlen).
- Zone Recovery Pips - Die Anzahl der Pips, die bei den Berechnungen der Zone Recovery berücksichtigt werden. Am Ende der Zone Recovery müssen die Trades in der entgegengesetzten Richtung zum ursprünglichen Trade eröffnet werden.
- Berechnungsmodus
Zwei Modi sind verfügbar: BreakEven und Profit
BreakEven: Die Berechnungen versuchen, Ihnen Lotgrößen zu geben, um bei Schließung aller Trades null oder minimale Verluste zu erzielen. Langsamere Margin-Abnahme.
Profit: Die Berechnungen versuchen, Ihnen Lotgrößen zu geben, um das Gewinnziel des ursprünglichen offenen Trades zu erreichen. Schnellere Margin-Abnahme. - Zone Recovery Bereiche zeichnen - Wählen Sie Ja, wenn Sie die Zone Recovery Bereiche im Chart gezeichnet haben möchten.
- Tabellenfarbe / Schriftfarbe - Farboptionen für die Hedging-Tabelle.
Zusammenfassung
Kundenbewertungen
5 | 100 % | |
4 | 0 % | |
3 | 0 % | |
2 | 0 % | |
1 | 0 % |


