
CandleColourFlow_MultiFx
指标
2 购买
版本 1.0, Jul 2025
Windows 版、Mac 版
4.0
评价:2
说明
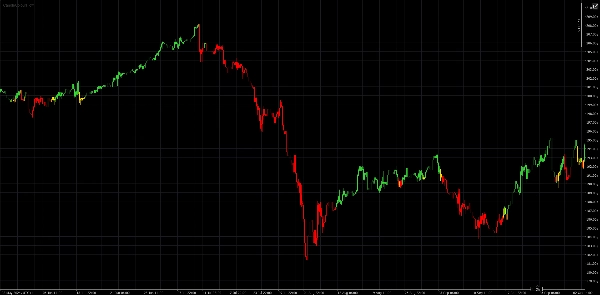
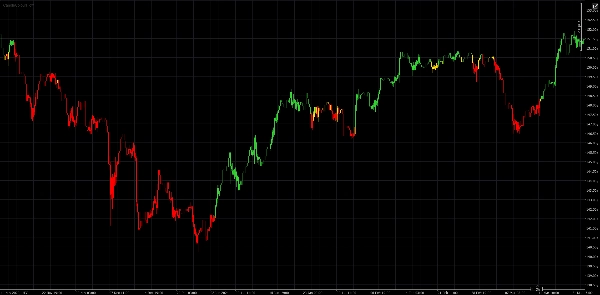
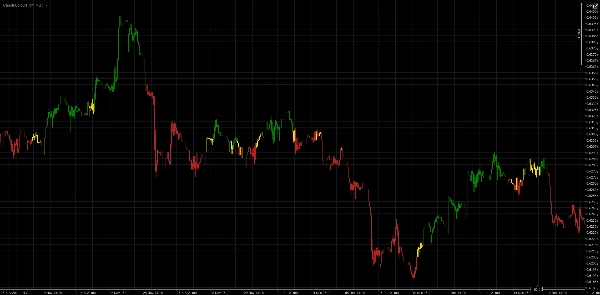
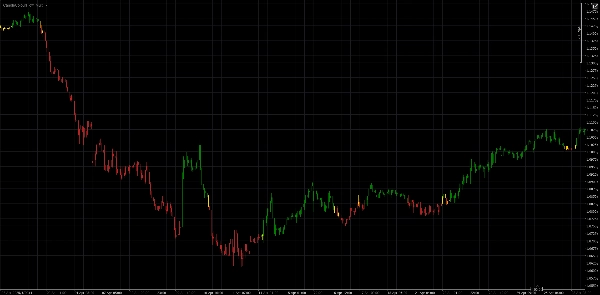
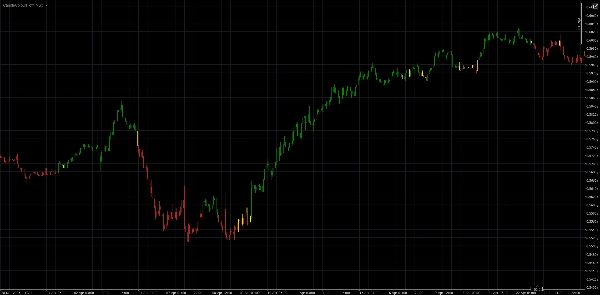
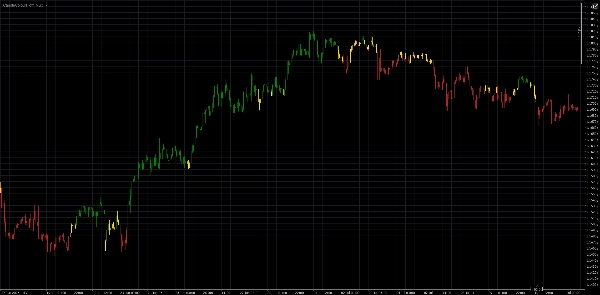
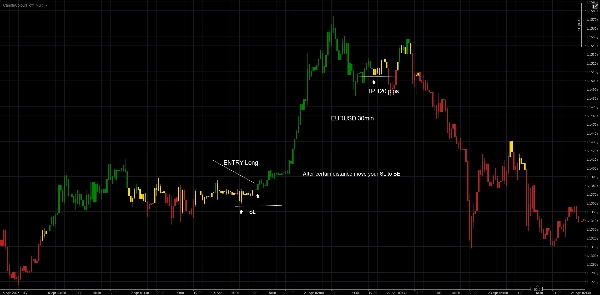
CandleColourFlow 是一个创新的指标,旨在清晰快速地识别外汇市场的趋势和市场转折点。通过其简单直观的颜色系统,即使是初学者交易者也能做出更明智的交易决策。
🔹 绿色蜡烛 – 表示开多仓的有利条件
🔹 红色蜡烛 – 表示潜在的做空交易机会
🔹 金色蜡烛 – 表示市场犹豫不决:可能是盘整或趋势延续
💡 CandleColourFlow 有何独特之处?
- 无需多个指标即可清晰直观地了解市场状况
- 自动检测动量变化和价格结构变化
- 非常适合快速评估整体市场状态
- 适用于所有时间框架,但我认为1小时及以上效果最佳,具体取决于个人偏好
⚠️ 法律免责声明:
本指标仅供教育用途。它不构成投资建议或执行任何金融交易的推荐。
想了解更多?
CandleColourFlow 的更多版本即将推出——每个版本都具有独特功能和更广泛的市场支持。
摘要
AI 摘要
CandleColourFlow_MultiFx is a Forex market indicator designed to identify trends and potential turning points using a straightforward color-coded system. It displays green candles to indicate favorable conditions for long positions, red candles to suggest potential short trade opportunities, and gold candles to signal market indecision, such as consolidation or possible trend continuation. The indicator provides clear visual insights into market conditions without requiring multiple tools, automatically detects momentum shifts and changes in price structure, and facilitates quick assessment of overall market state. It is optimized for use on Forex majors, minors, and crosses, and functions across all timeframes, with a preference for 1-hour and higher intervals. This tool is intended for educational purposes and does not constitute investment advice.
指标配置
客户评价
4.0
评价:2
5 | 0 % | |
4 | 100 % | |
3 | 0 % | |
2 | 0 % | |
1 | 0 % |
客户评价
July 25, 2025
讨论
常见问答
cTrader Store 提供的所有产品,包括交易机器人、指标和插件,均由第三方开发者提供,仅供信息参考和技术访问之用。cTrader Store 并非经纪商,不提供投资建议、个人推荐或任何未来业绩保证。
该作者的其他作品


猜您喜欢


价格
注册日期 25/02/2025
2
销售
265
免费安装