
Zig-Zag Extremity Tracker
指标
2 购买
版本 1.0, Mar 2025
Windows 版、Mac 版
4.5
评价:2
说明
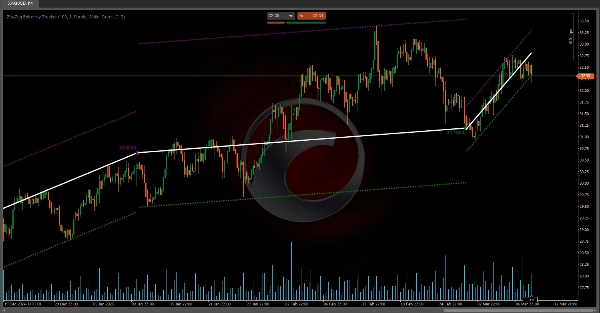
💡 线性回归通道和ZigZag点 💡
• 线性回归通道 每当价格超出预期边界(带)时都会重新计算和重置,确保测量与市场的真实趋势保持最新。
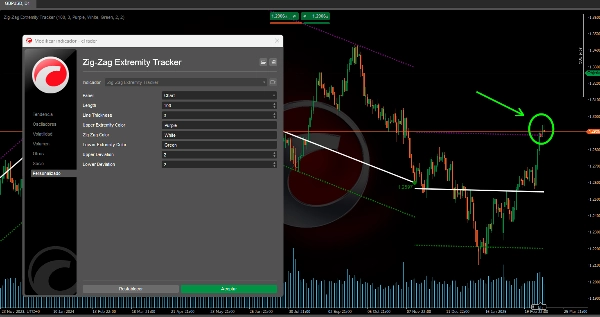
• 标记的点(圆圈) 代表极值(高点和低点),作为绘制ZigZag和确定通道计算起点的基础。
• 这种动态方法 允许更好地可视化潜在的趋势变化,以及价格可能回归均值的过度延伸或超卖区域。
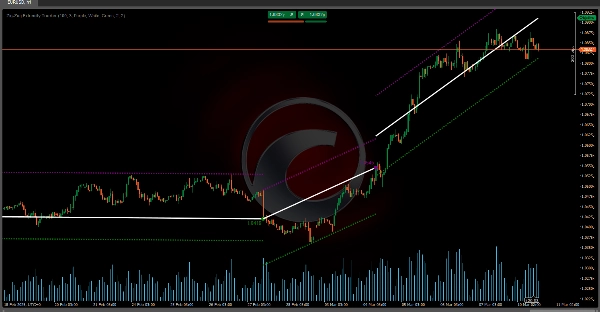
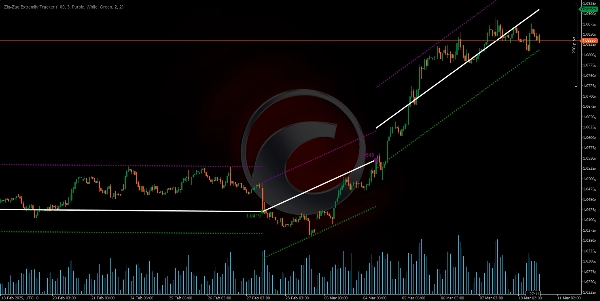
❓ 通道如何与ZigZag和极值点相关联? ❓
• 每当检测到新的极值(高点或低点)时,指标不仅绘制一个圆圈和连接该点与前一点的ZigZag线,还会重新调整从该最后极值绘制的潜在线性回归通道。
• 如果在接下来的柱线中,价格保持在带内,通道保持激活状态并延伸到当前柱线。
• 如果价格在任何时候突破这些带,指标“假设”通道已失效,并从发生突破的柱线开始新的通道。
Ctrader商店指标:
摘要
指标配置
客户评价
4.5
评价:2
5 | 50 % | |
4 | 50 % | |
3 | 0 % | |
2 | 0 % | |
1 | 0 % |
客户评价
March 18, 2025
March 11, 2025
It makes sense mainly because the decision feels less rushed, and the first test should keep DD under 3 percent.
讨论
常见问答
Breakout
Supertrend
RSI
cTrader Store 提供的所有产品,包括交易机器人、指标和插件,均由第三方开发者提供,仅供信息参考和技术访问之用。cTrader Store 并非经纪商,不提供投资建议、个人推荐或任何未来业绩保证。


价格
注册日期 03/10/2024
163
销售
37.84K
免费安装