
RSI Divergence
指标
1.55K 下载
版本 1.0, Feb 2025
Windows 版、Mac 版
4.0
评价:1
说明
Pinescriptlabs 商店指标: Pinescriptlabs 商店 cBots : (cBot) Gold & BTC 突破会话枢轴(新)
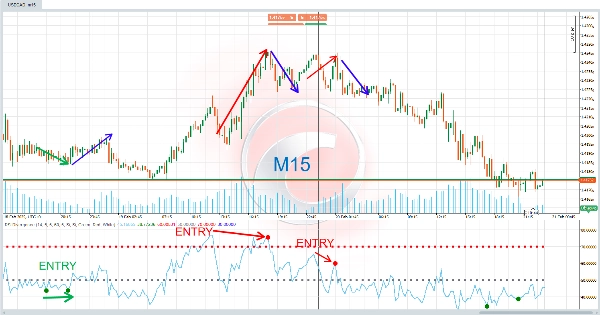
RSI 背离 是一种高级技术分析工具,旨在检测 价格与相对强弱指数(RSI)之间的背离。这些背离是强有力的信号,可以预示市场方向的变化,使其成为技术交易者的宝贵资源。🔍💡
⚙️ 它是如何工作的?
该指标基于价格和 RSI 并非总是同步移动的原理。当出现背离时,意味着价格发出了与基础 RSI 趋势相反的信号。这可能是当前趋势可能失去动力的早期警告。
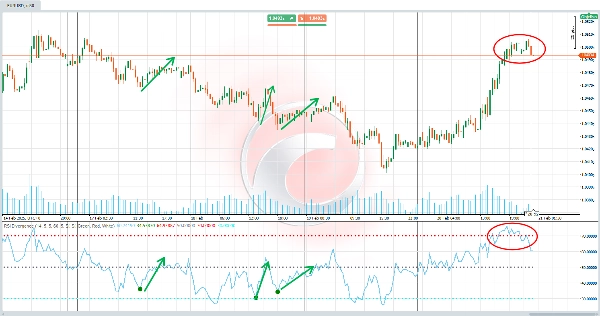
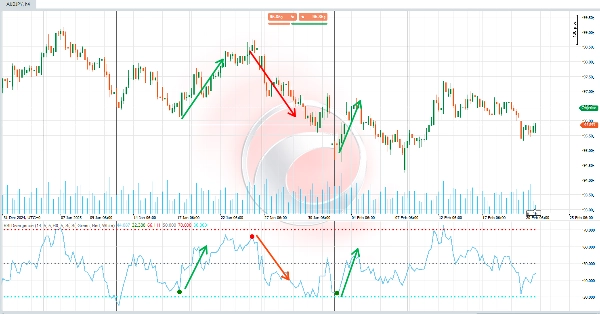
- 看涨背离(上升趋势)📈 :
当价格形成更低的低点时,RSI 形成更高的低点。这表明尽管价格在下跌,上升动能可能正在增强,可能导致向上的反转。✅ - 看跌背离(下降趋势)📉 :
当价格形成更高的高点时,RSI 形成更低的高点。这表明尽管价格在上涨,下行动能可能正在增强,可能导致向下的反转。❌
该指标会自动检测这些背离,并通过颜色、线条和标签在图表上突出显示,便于解读。🎯
💡 它的用途是什么?
该指标特别适用于:
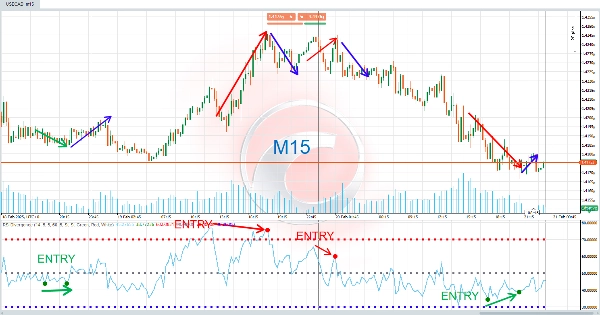
- 识别进出场点:背离可以作为买入(看涨)或卖出(看跌)信号。🛒💸
- 预测趋势变化:背离是当前趋势可能失去动力的早期信号。⚡
- 确认技术分析:可与其他指标或蜡烛图形态结合使用,以验证交易决策。🧠📊
它适用于日内交易者和长期投资者,因为背离适用于任何时间框架。⏳📈
🛠️ 如何使用?
- 初始设置:
-
- 根据您的需求自定义参数,如 RSI 周期、枢轴搜索范围和信号颜色。🎨⚙️
- 根据偏好启用或禁用看涨或看跌背离的显示。✅❌
- 信号解读:
-
- 看涨背离 :当图表上出现绿色 "D" 信号时,表示可能的买入机会。🟩🛒
- 看跌背离 :当图表上出现红色 "D" 信号时,表示可能的卖出机会。🟥🚫
- 此外,连接背离点的线条被绘制以便于视觉分析。📐🔗
- 决策制定:
-
- 使用这些信号调整策略,如开仓、平仓或调整止损水平。🤝💼
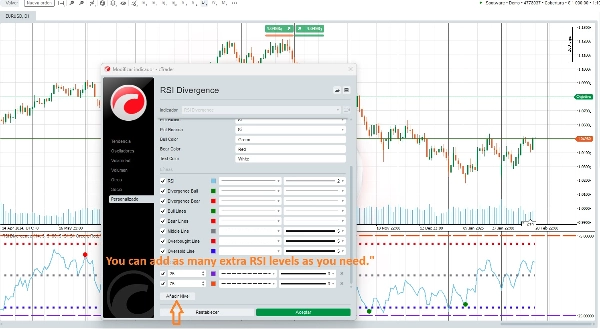
🆕 高级自定义!
🌟 您可以添加任意数量的 RSI 水平 🌟
该指标允许您完全自定义交易体验。您可以添加多个 RSI 水平,以适应不同的策略和交易风格。例如,您可以配置额外的超买和超卖水平,甚至调整 RSI 周期以适应不同的时间框架。🔄📈📉
摘要
AI 摘要
The RSI Divergence indicator is a technical analysis tool that identifies divergences between price movements and the Relative Strength Index (RSI). It detects situations where price and RSI trends do not align, signaling potential changes in market direction. The indicator automatically highlights bullish divergences—where price forms lower lows but RSI forms higher lows, suggesting possible upward reversals—and bearish divergences—where price forms higher highs but RSI forms lower highs, indicating potential downward reversals. These signals are displayed on the chart with colored labels and connecting lines for clear visualization.
Designed for use on any timeframe, the indicator helps traders identify entry and exit points, anticipate trend changes, and confirm other technical analysis signals. Users can customize parameters such as RSI period, pivot search ranges, signal colors, and enable or disable specific divergence types. Additionally, multiple RSI levels can be added to tailor the indicator to various trading strategies and styles.
This tool is suitable for intraday traders and long-term investors across markets including cryptocurrencies (e.g., BTCUSD), commodities (e.g., gold, XAUUSD), and indices. It supports enhanced decision-making by providing early warnings of trend strength shifts based on RSI divergence analysis.
指标配置
客户评价
4.0
评价:1
5 | 0 % | |
4 | 100 % | |
3 | 0 % | |
2 | 0 % | |
1 | 0 % |
客户评价
July 14, 2025
Pros: Automatically detects RSI divergences with clean chart lines. Includes alerts and customizable settings. Cons: No tooltips or signal filtering. Can generate noise during strong trends. No template saving or historical signal log.
讨论
常见问答
BTCUSD
Signal
Breakout
Indices
Supertrend
Commodities
RSI
Crypto
XAUUSD
ATR
cTrader Store 提供的所有产品,包括交易机器人、指标和插件,均由第三方开发者提供,仅供信息参考和技术访问之用。cTrader Store 并非经纪商,不提供投资建议、个人推荐或任何未来业绩保证。


猜您喜欢


价格
注册日期 03/10/2024
163
销售
37.8K
免费安装