Opis
Wskaźniki Pinescriptlabs Store: Pinescriptlabs Store cBoty : (cBot) Gold & BTC BreakoutSession Pivots(nowy)
Projekcja płynności ceny ZigZag
Inteligentny algorytm podążający (nowy)
Prognoza oparta na Linreg & ATR
SmartTrend wsparcie i
opór
linie
Dynamiczna
analiza struktury rynku
punktów zwrotnych
of
Turning
Punkty
Fibonacci
Regresja liniowa
wieloczasowa
Multi-timeframe
Luka wartości godziwej momentum
Wielopoziomowy
Tracker nachylenia świec
Tracker
Automatyczne
wsparcie i
opór
linie trendu
linie
Wszystkie
wsparcie i
opór
poziomy
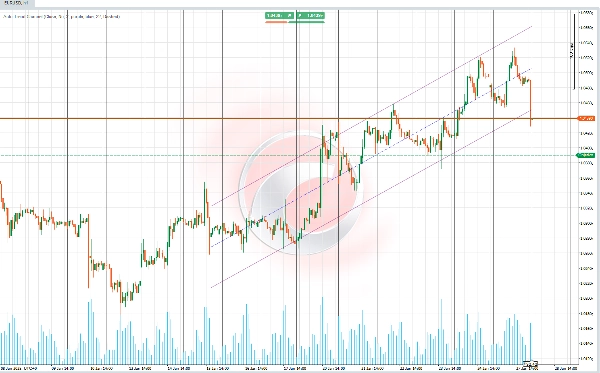
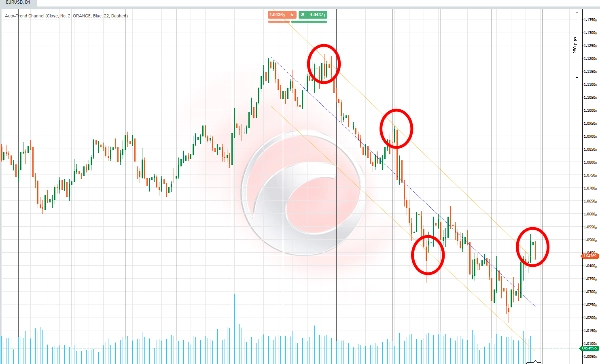
📊 Auto-Kanał trendu 📊
Ten wskaźnik rysuje kanał trendu oparty na obliczeniu regresji liniowej i odchylenia standardowego danych cenowych (logarytmicznych) dla okresu wybranego automatycznie. 📈 Okres jest określany za pomocą współczynnika korelacji Pearsona (RRR), wybierając ten o najwyższej wartości bezwzględnej. 🧮
✨ Główna funkcjonalność ✨
Podstawową funkcją jest obliczenie kanału trendu, który automatycznie dostosowuje się do najbardziej reprezentatywnej długości okresu, wykorzystując zaawansowaną statystykę do określenia wsparcia, oporów oraz centralnej linii trendu.
Kanał zawiera:
1️⃣ linię bazową reprezentującą obliczony trend liniowy.
2️⃣ Górne i dolne linie definiujące pasma kanału w odległości proporcjonalnej do odchylenia standardowego.
🚀 Funkcje i obliczenia 🚀
🔎 Optymalne obliczenie okresu
- Wskaźnik ocenia wiele okresów danych (krótkich lub długich, w zależności od konfiguracji), aby znaleźć ten z najdokładniejszą korelacją z zachowaniem rynku.
- Jako kluczową miarę do identyfikacji okresu o najsilniejszym związku między historyczną ceną a generowaną linią trendu wykorzystuje się współczynnik korelacji Pearsona.
📐 Regresja liniowa i projekcja ceny
- Dla każdego ocenianego okresu obliczana jest linia regresji oparta na logarytmie naturalnym cen, aby ustabilizować ekstremalne zmiany.
- Kluczowe elementy obliczenia obejmują:
-
- Nachylenie: Reprezentuje tempo zmiany ceny.
- Przecięcie: Punkt startowy prognozowanej linii.
- Średnia: Ustanawia linię odniesienia.
📊 Odchylenie standardowe i granice kanału
- Obliczane jest odchylenie standardowe cen względem linii regresji.
- Górne pasmo (opór) oraz dolne pasmo (wsparcie) są wyprowadzane przez dostosowanie linii centralnej za pomocą konfigurowalnego przez użytkownika mnożnika odchylenia standardowego.
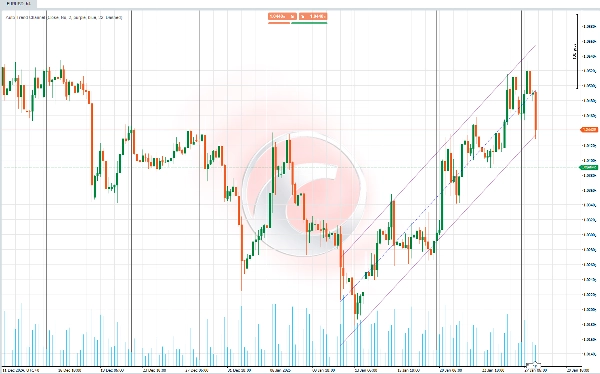
🌈 Wizualizacja kanału trendu
- Kanał składa się z trzech głównych elementów:
-
- Linia centralna: Pokazuje główny trend oparty na linii regresji.
- Linia górna: Reprezentuje górną granicę kanału (opór), dostosowaną przez odchylenie standardowe.
- Linia dolna: Reprezentuje dolną granicę kanału (wsparcie), dostosowaną przez odchylenie standardowe.
- Użytkownicy mogą dostosować kolory, przezroczystość i style linii kanału dla lepszej czytelności wizualnej.
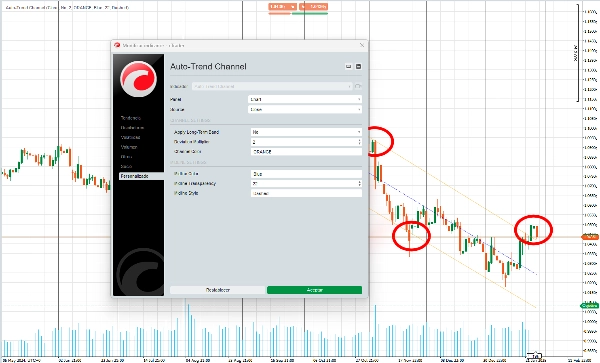
🎛️ Dostosowanie i konfiguracja
- Użytkownicy mogą personalizować różne aspekty wskaźnika, takie jak:
-
- Kolory linii i kanału.
- Czy skupić się na długich okresach (makro trendy) lub krótkich okresach (mikro trendy).
- Ta elastyczność zapewnia, że wskaźnik pasuje do różnych stylów handlu i preferencji wizualnych.
🔍 Zastosowanie :
1️⃣ Identyfikacja trendu
- Centralna linia kanału pomaga określić, czy rynek znajduje się w trendzie wzrostowym, trendzie spadkowym, czy trendzie bocznym.
2️⃣ Dynamiczne wsparcie i opór
- Górne i dolne linie kanału działają jako potencjalne strefy, gdzie cena może odwrócić się lub konsolidować się.
3️⃣ Wykrywanie konsolidacji i wybicia
- Ceny pozostające w kanale sugerują konsolidację, podczas gdy wybicie wskazuje na zmianę trendu lub silny ruch cenowy.
4️⃣ Dostosowanie do różnych stylów handlu
- Długie okresy są przydatne do identyfikacji ogólnych trendów i podejmowania strategicznych decyzji na szerszych ramach czasowych.
- Krótkie okresy pozwalają traderom uchwycić szybsze ruchy i reagować na natychmiastowe zmiany na rynku.
Podsumowanie
Key features include:
- Optimal period selection by evaluating multiple data intervals to find the strongest correlation between historical prices and the trend line.
- Calculation of slope, intercept, and mean for precise linear regression and price projection.
- Visualization of the trend channel with customizable colors, transparency, and line styles.
- Adaptability for different trading styles by allowing focus on long-term (macro) or short-term (micro) trends.
Use cases:
- Identifying market trends (uptrend, downtrend, sideways) via the central trend line.
- Detecting dynamic support and resistance zones where price may reverse or consolidate.
- Recognizing consolidation phases within the channel and breakouts signaling trend changes or strong price movements.
- Adjusting analysis to suit strategic decisions or faster market responses depending on selected period length.
This indicator supports various markets including cryptocurrencies (BTCUSD), commodities (XAUUSD), and others, providing a statistical approach to trend and channel analysis.
Opinie klientów
5 | 60 % | |
4 | 20 % | |
3 | 20 % | |
2 | 0 % | |
1 | 0 % |