
Fixed Range Volume Profile - FRVP
지표
3 구매
버전 1.0, Mar 2026
Windows, Mac
4.5
리뷰: 2
설명
Fixed Range Volume Profile Pro
이 지표는 거래량이 실제로 중요한 위치를 간단히 확인하고자 하는 트레이더를 위해 만들어졌습니다.
지지선과 저항선을 추측하는 대신 범위를 정의하고 시장이 대부분의 시간을 보낸 위치를 즉시 확인할 수 있습니다. 주요 레벨인 POC, VAH, VAL을 강조하여 반응 가능성이 높은 영역에 집중할 수 있습니다.
표시 내용
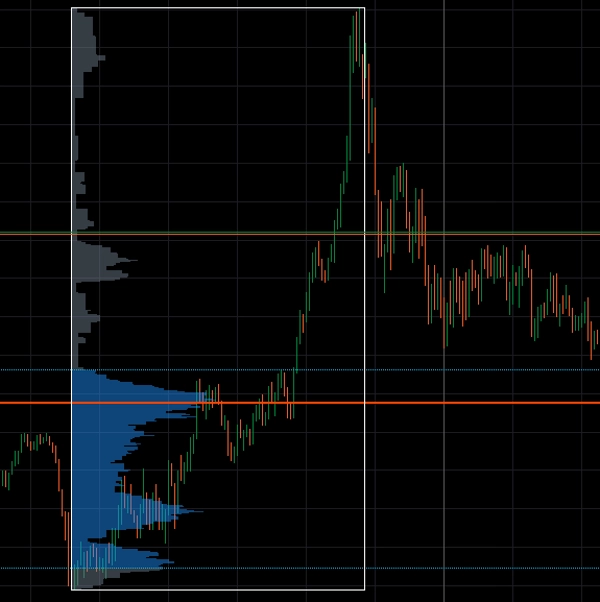
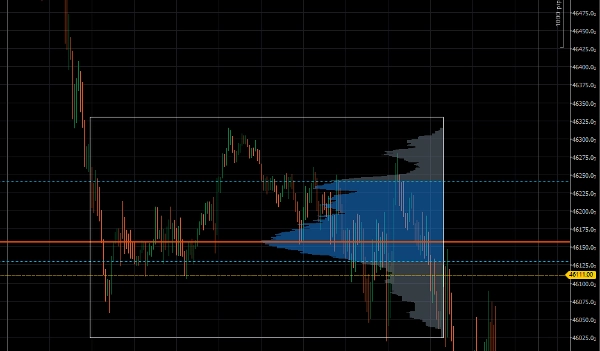
범위를 선택하면 지표가 해당 차트 구간을 기반으로 거래량 프로필을 생성합니다.
다음 항목을 강조합니다:
- POC (Point of Control)
가장 많은 거래량이 발생한 가격. 이 레벨은 자석처럼 작용하는 경우가 많습니다. - VAH (Value Area High)
거래 활동이 가장 많이 일어난 구간의 상한선. - VAL (Value Area Low)
같은 가치 구간의 하한선.
이 레벨들은 다음을 빠르게 확인하는 데 도움이 됩니다:
- 가격이 “공정한” 위치
- 반전 가능성이 있는 위치
- 돌파가 일어날 수 있는 위치
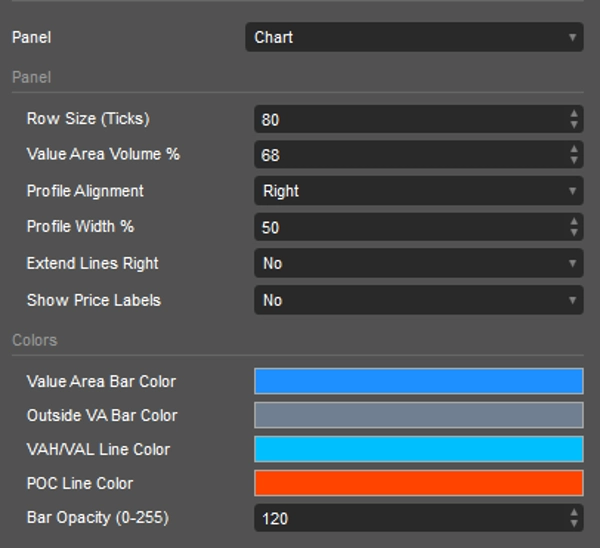
설정:
- 행 크기 (틱)
프로필의 세부 정도를 조절합니다
낮을수록 세부적, 높을수록 부드럽게 표시 - 가치 영역 거래량 % (기본값 68)
얼마나 많은 거래량을 “가치”로 간주할지 정의합니다 - 프로필 정렬
프로필을 왼쪽 또는 오른쪽으로 이동합니다 - 프로필 너비 %
히스토그램의 너비를 조절합니다 - 오른쪽으로 선 연장
POC / VAH / VAL을 미래 가격까지 표시합니다 - 가격 라벨 표시
정확한 가격 레벨을 표시합니다
대상 사용자:
- 정확한 레벨을 찾는 스캘퍼
- 일중 거래자 (US30, NASDAQ, Forex)
- TradingView의 고정 범위 도구에 익숙한 사용자
마지막 참고 사항
이 지표는 가격 움직임과 함께 사용할 때 가장 효과적입니다.
신호를 제공하거나 진입 시점을 알려주지는 않지만 주의를 기울여야 할 위치를 보여줍니다.
요약
AI 요약
Fixed Range Volume Profile (FRVP) is a trading indicator designed to display volume distribution within a user-defined price range on a chart. It highlights key volume-based levels: Point of Control (POC), where the highest volume traded; Value Area High (VAH), the upper boundary of significant trading volume; and Value Area Low (VAL), the lower boundary. These levels help traders identify fair price areas, potential reversal points, and breakout zones.
Users select a specific range on the chart, and the indicator generates a volume profile histogram for that segment. Adjustable settings include row size (tick granularity), value area volume percentage (default 68%), profile alignment, histogram width, line extension into future price, and price label display.
FRVP is suitable for scalpers, intraday traders, and those familiar with TradingView’s fixed range volume profile tool. It supports various markets including Forex, indices, commodities, stocks, and cryptocurrencies. The indicator does not provide trade signals but serves as a visual tool to focus attention on important volume levels when combined with price action analysis.
지표 프로필
고객 리뷰
4.5
리뷰: 2
5 | 50 % | |
4 | 50 % | |
3 | 0 % | |
2 | 0 % | |
1 | 0 % |
상담
자주 묻는 질문(FAQ)
BTCUSD
Forex
Signal
Breakout
Indices
EURUSD
Commodities
GBPUSD
NZDUSD
Martingale
Prop
Scalping
SMC
Crypto
Grid
Stocks
AI
XAUUSD
NAS100
USDJPY
VWAP
트레이딩 봇, 지표, 플러그인 등 cTrader Store에서 제공되는 상품은 제3자 개발자에 의해 제공되며, 이는 단순히 정보 및 기술적 접근을 목적으로 제공된 것입니다. cTrader Store는 중개인이 아니며, 투자 조언, 개인별 추천 또는 향후 성과에 대한 어떠한 보장도 제공하지 않습니다.


가격
가입일 27/10/2025
2
판매