
Cross EMA Pro
Indikator
2 käufe
Version 1.0, Sep 2024
Windows, Mac
4.5
Bewertungen: 2
Beschreibung
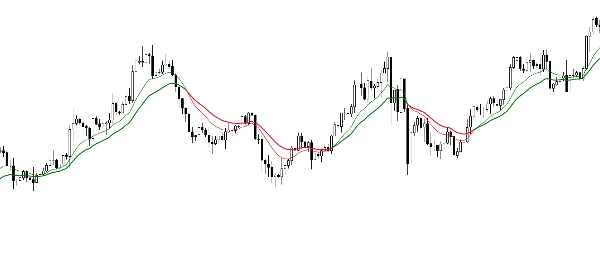
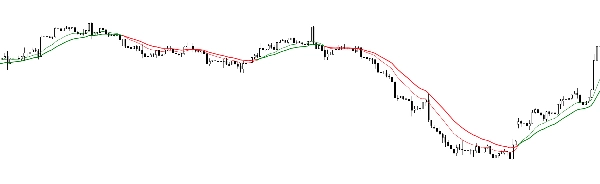
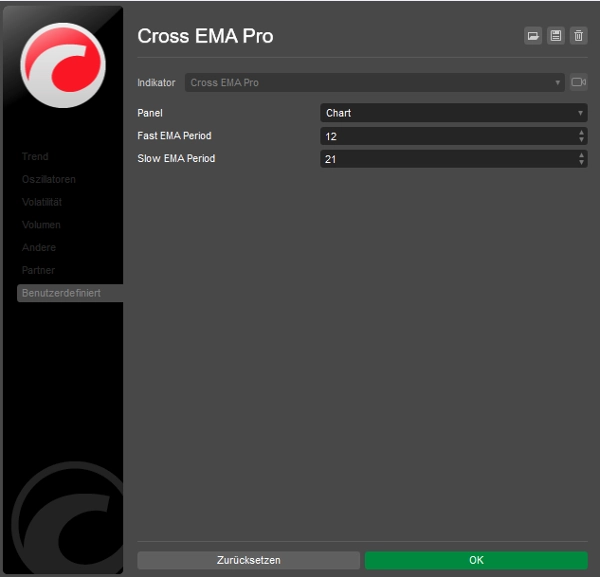
Der Cross EMA Pro hilft Ihnen, Trendwenden präzise zu erkennen, indem er die Kreuzung der 12-Perioden- und 21-Perioden-EMAs visualisiert. Die Farbgebung erleichtert es, Trendrichtungen schnell zu erkennen.
- Crossover-Signale: Basierend auf 12-Perioden- und 21-Perioden-EMAs
- Farbkodiert: Grün für Aufwärtstrends, Rot für Abwärtstrends
- Flexible Verwendung: Geeignet für Scalping, Daytrading und langfristige Strategien
Zusammenfassung
KI-Zusammenfassung
Cross EMA Pro is a trend reversal indicator that visualizes the crossover of 12-period and 21-period exponential moving averages (EMAs). It uses color coding—green for uptrends and red for downtrends—to help users quickly identify trend directions. The indicator provides clear crossover signals based on these two EMAs, making it suitable for various trading styles including scalping, day trading, and long-term strategies. It supports multiple markets such as Forex, stocks, indices, commodities, and cryptocurrencies including BTCUSD and XAUUSD. The indicator outputs visual signals on price charts to assist traders in recognizing potential trend reversals.
Indikatorprofil
Indikatorkategorie
Trend
Ausgabetyp
Visualisierung
Datenanforderungen
Nur Balken
Kundenbewertungen
4.5
Bewertungen: 2
5 | 50 % | |
4 | 50 % | |
3 | 0 % | |
2 | 0 % | |
1 | 0 % |
Kundenbewertungen
September 22, 2024
September 22, 2024
No reason to yolo this live without a few normal sessions, and M15 is enough for the first pass.
Diskussion
Häufig gestellte Fragen (FAQ)
BTCUSD
Forex
Indices
Commodities
Crypto
Stocks
XAUUSD
Über den cTrader Store verfügbare Produkte, einschließlich Handelsbots, Indikatoren und Plugins, werden von externen Entwicklern bereitgestellt und nur zu Informations- und technischen Zugriffszwecken verfügbar gemacht. cTrader Store ist kein Broker und erbringt keine Anlageberatung, persönlichen Empfehlungen oder eine Garantie für zukünftige Performance.
Mehr von diesem Autor


Preis
Seit 11/09/2024
7
Verkäufe