
Opis
🚀 Ponad 10 000 traderów już korzysta z naszych NAJLEPSZYCH wskaźników🏆
Dowiedz się, dlaczego profesjonaliści wybierają nas – najpotężniejsze narzędzia na cTrader (wskaźniki, algorytmy i cBoty) czekają na Ciebie.
👉 Pobierz wszystkie nasze NAJLEPSZE systemy tutaj:
_______________________________________________
📌 Wskaźniki struktury rynku
· ✅ AdvancedMarket Structure: Bos, Choch, SwinLevels, Order Blocks, Market Structure& Liquidity Finder
· 🔄 Dynamic Market StructureAnalysis of Turning Points
· 🧱 Order Block
· ⚖️ Market Imbalance
· ⛓️ BOS & CHOCH
· 🧠 ICT Power of 3
_______________________________________________
🔚 Inteligentne systemy wyjścia
_______________________________________________
📐 Wskaźniki ZigZag
· 🔍 ZigZag Price LiquidityProjection
· ➖ ZigZag
_______________________________________________
🧱 Wskaźniki wsparcia i oporu
· 🟩 SmartTrend Support &Resistance Lines
· 🧱 All Support and ResistanceLevels
_______________________________________________
📊 Wskaźniki trendu i kanału
· 📊 Supertrend
_______________________________________________
💧 Narzędzia wolumenu i płynności
_______________________________________________
⚡ Wskaźniki momentum i RSI
· 🔎 Multi-Level Candle Bias
Tracker
_______________________________________________
🔮 Narzędzia predykcji i projekcji
· 📐 Prediction Based on Linreg& ATR
· 📏 Fibonacci Linear RegressionMulti-timeframe
· 📈 Volume-Powered Market Flow Projector
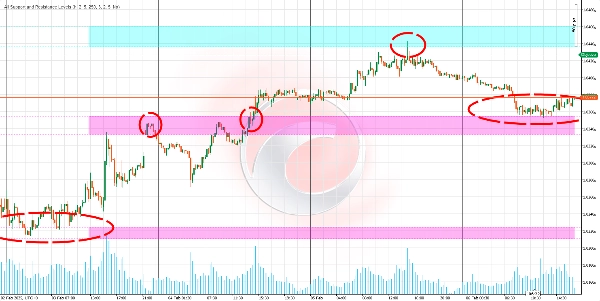
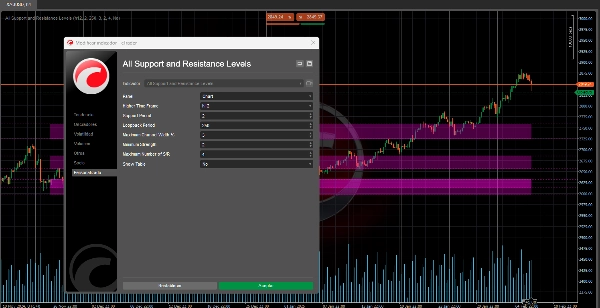
Ten algorytm jest zaawansowanym wskaźnikiem wsparcia i oporu, zaprojektowanym, aby pomóc Ci zidentyfikować kluczowe poziomy na rynku.
Jego główną zaletą jest możliwość wyświetlania poziomów wsparcia i oporu z dowolnego interwału czasowego (takiego jak dzienny, tygodniowy czy miesięczny) bezpośrednio na analizowanym wykresie, nawet jeśli jest on na innym interwale (np. 15 minut lub 1 godzina). 📊⏰
Do czego służy? 🎯
Identyfikacja kluczowych stref rynkowych:
- Wykrywanie poziomów, na których cena może się zatrzymać, odbić lub przebić z siłą. 🛑↗️↘️
- Pomaga podejmować bardziej świadome decyzje dotyczące wejść, wyjść i stop-lossów. 💡📈📉
Analiza wielu interwałów bez przełączania wykresów:
- Wyświetlanie ważnych poziomów z wyższych interwałów (np. dziennych lub tygodniowych) podczas handlu na niższych interwałach (np. 15 minut lub 1 godzina). 🕒📅
- Zapewnia szerszy obraz rynku bez konieczności ciągłego przełączania wykresów. 🌍🔍
Priorytetyzacja istotnych poziomów:
- Wskaźnik klasyfikuje poziomy wsparcia i oporu na podstawie ich "siły", czyli jak często cena miała z nimi kontakt w przeszłości. 💪📊
- Pomaga to skupić się na najbardziej istotnych i wiarygodnych poziomach. 🎯✅
Jak działa logika? 🧠⚙️
Zbieranie danych:
- Wskaźnik pobiera ceny maksymalne i minimalne z określonego interwału czasowego (dzienny, tygodniowy itp.). 📈📉
- Te dane są wykorzystywane do wyszukiwania kluczowych wzorców zachowania ceny. 🔍📊
Wykrywanie kluczowych punktów (pivotów):
- Identyfikuje lokalne maksima i minima — punkty, gdzie cena osiągnęła szczyt lub dolinę w porównaniu z pobliskimi cenami. ⛰️🌄
- Te punkty są kandydatami na poziomy wsparcia lub oporu. 🎯📌
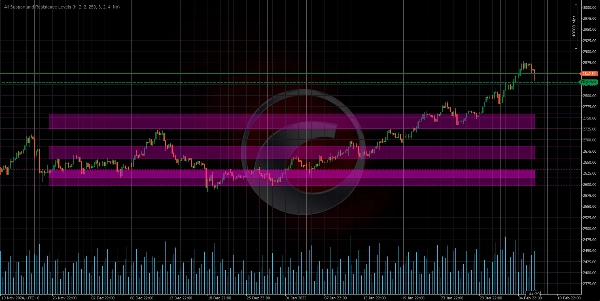
Grupowanie poziomów:
- Bliskie poziomy są grupowane, tworząc strefy wsparcia lub oporu, zamiast dokładnych linii. 🟦🟧
- Odzwierciedla to ideę, że wsparcie i opór to obszary, a nie precyzyjne punkty. 📏🎯
Obliczanie siły poziomu:
"Siła" poziomu jest określana przez dwa czynniki:
- Częstotliwość dotknięć: Ile razy cena dotknęła lub zbliżyła się do tego poziomu w przeszłości. 🔄📊
- Grupowanie kluczowych punktów: Ile maksimów lub minimów znajduje się blisko tego poziomu. 🔗📈
Poziomy o większej sile są uważane za bardziej istotne. 💪🎯
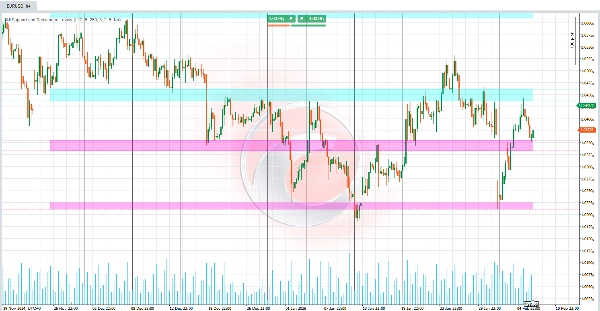
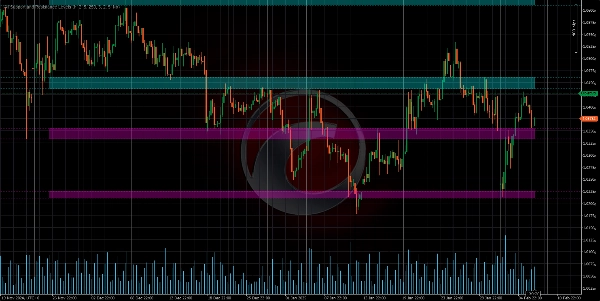
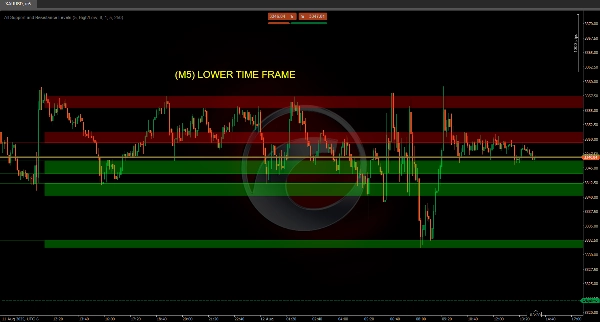
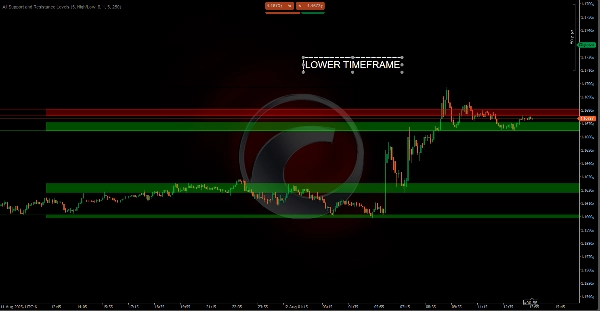
Wizualizacja na wykresie:
- Poziomy są rysowane jako linie poziome lub kolorowe strefy na wykresie. 🎨📊
- Kolor każdego poziomu zależy od aktualnej pozycji ceny:
-
- Opór: Jeśli cena jest poniżej poziomu. 🔴
- Wsparcie: Jeśli cena jest powyżej poziomu. 🟢
- W zakresie: Jeśli cena znajduje się w zakresie poziomu. 🟡
Jak wyświetlać różne interwały na wykresie? 🕒📊
Wsparcie i opór z wyższych interwałów na wykresach niższego interwału:
- Na przykład, analizując wykres 15-minutowy, wskaźnik może pokazać kluczowe poziomy z interwału dziennego lub tygodniowego. 🕒📅
- Pozwala to zobaczyć ważne poziomy z szerszego kontekstu bez opuszczania aktualnego wykresu. 🌍🔍
Wsparcie i opór z niższych interwałów na wykresach wyższego interwału:
- Chociaż rzadziej, można również wyświetlać poziomy z mniejszych interwałów (np. 1-minutowego lub 5-minutowego) na wykresach wyższego interwału (np. dziennych lub tygodniowych). 🕒📅
- Może to być przydatne do bardziej szczegółowej analizy w szerszym kontekście. 🔍📊
Podsumowanie
The indicator analyzes price data by collecting highs and lows from specified timeframes, identifying local pivot points where price peaks or valleys occur. These points are grouped into zones representing support or resistance areas rather than precise lines. Each level is assigned a strength score based on the frequency of price touches and the clustering of key points, helping users prioritize the most significant and reliable levels.
Visualized on the chart as horizontal lines or colored zones, the indicator uses color coding to indicate the price's position relative to each level: red for resistance (price below level), green for support (price above level), and yellow when price is within the level’s range. This tool assists traders in making informed decisions on entries, exits, and stop-loss placements by highlighting where price may stop, bounce, or break with strength.
Opinie klientów
5 | 50 % | |
4 | 0 % | |
3 | 0 % | |
2 | 0 % | |
1 | 50 % |


![Logo „[Hamster-Coder] Moving Average MTF”](https://cdn.ctrader.com/image/webp/b11b98b1-194d-4b8e-b00e-d611826ad159_31226)


